


Axis Bank

Intraday Traders can use the below mentioned levels
Buy above 466 Tgt 469, 472 and 476 SL 463
Sell below 460 Tgt 456, 452 and 448 SL 463
Bajaj Finance

Intraday Traders can use the below mentioned levels
Buy above 3661 Tgt 3690, 3720 and 3750 SL 3645
Sell below 3640 Tgt 3615, 3585 and 3540 SL 3653
SRT
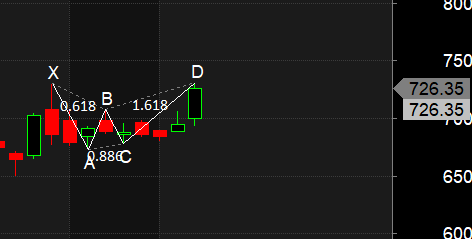
Intraday Traders can use the below mentioned levels
Buy above 731 Tgt 740, 747 and 754 SL 726
Sell below 721 Tgt 714, 709 and 702 SL 725
How to trade Intraday and Positional Stocks Analysis — Click on this link
Performance sheet for Intraday and Positional is discussed for June Month, Intraday Profit of 4.46 Lakh and Positional Profit of 6.49 Lakh. Please note we do not have any “ADVISORY Service”, I share this sheet to see how the system are performing and money can be made in Stock Market if Trading Systems are followed with discipline. Performance “Will differ” from trader to trader.
http://tradingsystemperformance.blogspot.in/
http://stockpositionaltrading.blogspot.in/
- All prices relate to the NSE Spot/Cash Market
- Calls are based on the previous trading day’s price activity.
- Intraday call is valid for the next trading session only unless otherwise mentioned.
- Stop-loss levels are given so that there is a level below/above, which the market will tell us that the call has gone wrong. Stop-loss is an essential risk control mechanism; it should always be there.
- Book, at least, part profits when the prices reach their targets; if you continue to hold on to positions then use trailing stops to lock in your profits.
GM ji, bajaj finance level cut & paste error