


Maruti
Positional Traders can use the below mentioned levels
Close above 6881 Target 7043
Buy above 6881 Tgt 6938,6970 and 7024 SL 6850
Sell below 6825 Tgt 6795,6750 and 6700 SL 6850
I BUlls Housing
Positional Traders can use the below mentioned levels
Close above 632 Target 666/687
Buy above 632 Tgt 643,651 and 660 SL 625
Sell below 620 Tgt 610,599 and 587 SL 625
Adani
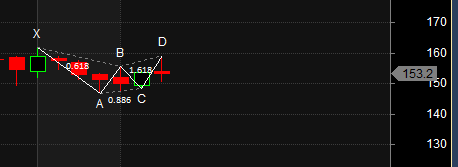
Positional Traders can use the below mentioned levels
Close below 151 Target 144
Buy above 155 Tgt 156,157 and 158 SL 154
Sell below 153 Tgt 152,151 and 150 SL 154
How to trade Intraday and Positional Stocks Analysis — Click on this link
Performance sheet for Intraday and Positional is discussed for May Month, Intraday Profit of 4.23 Lakh and Positional Profit of 8.78 Lakh. Please note we do not have any “ADVISORY Service”, I share this sheet to see how the system are performing and money can be made in Stock Market if Trading Systems are followed with discipline. Performance “Will differ” from trader to trader.
http://tradingsystemperformance.blogspot.in/
http://stockpositionaltrading.blogspot.in/
- All prices relate to the NSE Spot/Cash Market
- Calls are based on the previous trading day’s price activity.
- Intraday call is valid for the next trading session only unless otherwise mentioned.
- Stop-loss levels are given so that there is a level below/above, which the market will tell us that the call has gone wrong. Stop-loss is an essential risk control mechanism; it should always be there.
- Book, at least, part profits when the prices reach their targets; if you continue to hold on to positions then use trailing stops to lock in your profits.
Follow on Twitter:https://twitter.com/brahmesh
Follow on Facebook https://www.facebook.com/Brameshs-Tech-14011718268586
Youtube Channel: https://www.youtube.com/channel/UCxTIpotKybyOQIDsS3eEqhQ