


Ashok Leyland

Positional Traders can use the below mentioned levels
Close below 93 Target 89
Buy above 95 Tgt 96,97 and 99 SL 94
Sell below 93 Tgt 92,91 and 90 SL 94
Torrent Power
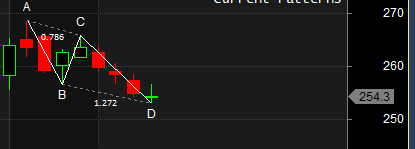
Positional Traders can use the below mentioned levels
Close above 256 Target 269
Buy above 256 Tgt 259,262 and 266 SL 254.5
Sell below 253 Tgt 250,247 and 244 SL 255
Tech M
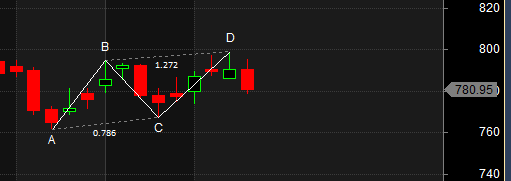
Positional Traders can use the below mentioned levels
Close below 777 Target 761/747
Buy above 785 Tgt 790,796 and 805 SL 780
Sell below 777 Tgt 772,766 and 761 SL 782
How to trade Intraday and Positional Stocks Analysis — Click on this link
Performance sheet for Intraday and Positional is discussed for March Month, Intraday Profit of 3.60 Lakh and Positional Profit of 5.74 Lakh. Please note we do not have any “ADVISORY Service”, I share this sheet to see how the system are performing and money can be made in Stock Market if Trading Systems are followed with discipline. Performance “Will differ” from trader to trader.
http://tradingsystemperformance.blogspot.in/
http://stockpositionaltrading.blogspot.in/
- All prices relate to the NSE Spot/Cash Market
- Calls are based on the previous trading day’s price activity.
- Intraday call is valid for the next trading session only unless otherwise mentioned.
- Stop-loss levels are given so that there is a level below/above, which the market will tell us that the call has gone wrong. Stop-loss is an essential risk control mechanism; it should always be there.
- Book, at least, part profits when the prices reach their targets; if you continue to hold on to positions then use trailing stops to lock in your profits.
Follow on Twitter:https://twitter.com/brahmesh
Follow on Facebook https://www.facebook.com/Brameshs-Tech-14011718268586
Youtube Channel: https://www.youtube.com/channel/UCxTIpotKybyOQIDsS3eEqhQ