


2018 year started with a rally from Bottom based on Gann Price Time Squaring we formed on Gujarat Election day Made Top on 29 Jan again Important time cycle date when both Gann Price and Time Squaring happened and we corrected 3000 points and bottomed on 23 March very Important Astro date as Mercury changed its speed Bank Nifty staged a spectacular rally all the way till 28388 we saw a Big reversal and fall till 24250, Bottom we captured as per our Astro Analysis on 27 Oct. Bank Nifty clocking a gain of 6 % in 2018. We can consider 2018 as year of consolidation after Big Rally we saw in 2017. Expect some good move in coming year as we approach the Election Year. Monthly and Yearly chart of Bank Nifty are shown below. Nifty Technical Outlook and Time Cycle Dates for 2019
Yearly Chart
Yearly chart have formed almost similar to Spinning Top Candlestick A Spinning Top indicates a strong fight going on between the bears and the bulls. The bulls are giving it their all, as are the bears. Nobody has won the fight yet, so the candle closes near to its open price.  If a Spinning Top appears during a bullish trend it suggests that the bulls could be losing control, and the trend could be ending. This is because until the spinning top formed the bulls had a very strong bullish trend. The spinning top suggests to traders that the bears are fighting back and the bulls are struggling to continue the bullish trend. Bulls should hold 27000 on Monthly closing basis and Bears should see Close below 26000 for Spinning Top Candle to show its effect.
Monthly Gann Chart
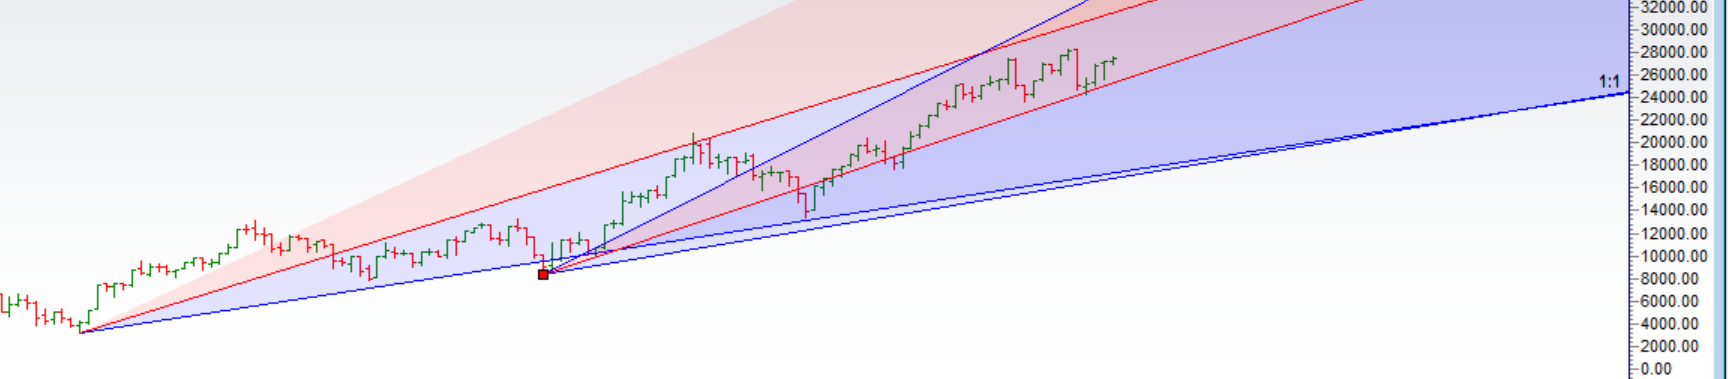
Monthly Chart with Supply and Demand Zone

Yearly Trend Change Level: 27000
Yearly Resistance Level : 28000,28657,29165,30000
Yearly Support Level : 26384,25750,25000,24389
Important Dates as per Time Analysis :
Last Year Time Cycle dates can be seen here Below dates can see Trend Change in Market.
01-01-19
08-01-19
17-01-19
25-01-19
10-02-19
19-02-19
03-03-19
12-03-19
22-03-19
10-04-19
29-04-19
02-05-19
22-05-19
12-06-19
24-06-19
23-07-19
10-08-19
18-08-19
30-08-19
05-09-19
19-09-19
01-10-19
25-10-19
14-11-19
29-11-19
09-12-19
26-12-19
Click Here to Like Facebook Page get Real time updates Follow on Twitter during Market Hours: https://twitter.com/brahmesh
Why is this Pahe Blank?
Its working fine