


Bharti Airtel

Positional Traders can use the below mentioned levels
Close above 421 Target 443
Intraday Traders can use the below mentioned levels
Buy above 420 Tgt 424,430 and 436 SL 416
Sell below 413 Tgt 409,405 and 400 SL 416
SBIN

Positional Traders can use the below mentioned levels
Close above 292 Target 310
Intraday Traders can use the below mentioned levels
Buy above 292 Tgt 296,300 and 305 SL 289
Sell below 287 Tgt 284,280 and 276 SL 289
KSCL
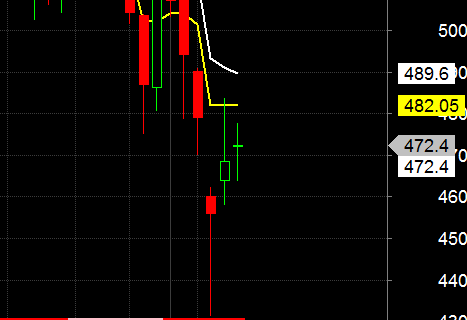
Positional Traders can use the below mentioned levels
Close below 460 Target 444
Intraday Traders can use the below mentioned levels
Buy above 466 Tgt 470,474 and 480 SL 462
Sell below 460 Tgt 456,452 and 444 SL 464
How to trade Intraday and Positional Stocks Analysis — Click on this link
Performance sheet for Intraday and Positional is updated for January Month, Intraday Profit of 5.57 Lakh and Positional Profit of 6.46 Lakh. Please note we do not have any “ADVISORY Service”, I share this sheet to see how the system are performing and money can be made in Stock Market if Trading Systems are followed with discipline. Performance “Will differ” from trader to trader.
http://tradingsystemperformance.blogspot.in/
http://stockpositionaltrading.blogspot.in/
- All prices relate to the NSE Spot/Cash Market
- Calls are based on the previous trading day’s price activity.
- Intraday call is valid for the next trading session only unless otherwise mentioned.
- Stop-loss levels are given so that there is a level below/above, which the market will tell us that the call has gone wrong. Stop-loss is an essential risk control mechanism; it should always be there.
- Book, at least, part profits when the prices reach their targets; if you continue to hold on to positions then use trailing stops to lock in your profits.
Follow on Facebook https://www.facebook.com/Brameshs-Tech-14011718268586
Follow on Twitter:https://twitter.com/brahmesh