


Ambuja Cememt
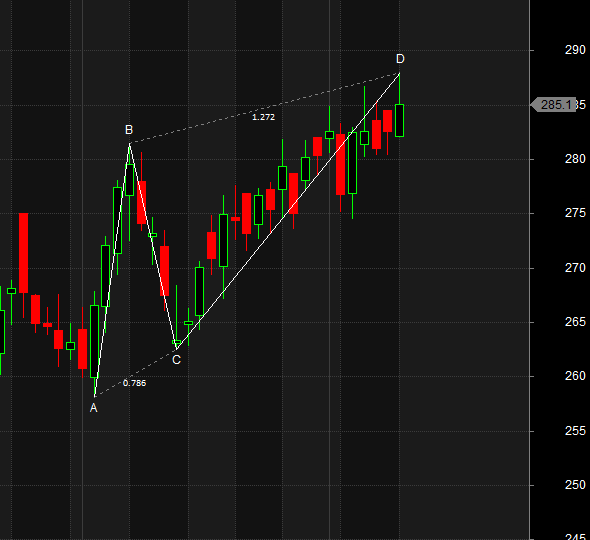
Positional Traders can use the below mentioned levels
Close below 283 Target 276
Intraday Traders can use the below mentioned levels
Buy above 286 Tgt 288, 291 and 294 SL 284.5
Sell below 283 Tgt 281,279 and 276 SL 284.5
Tata Communication
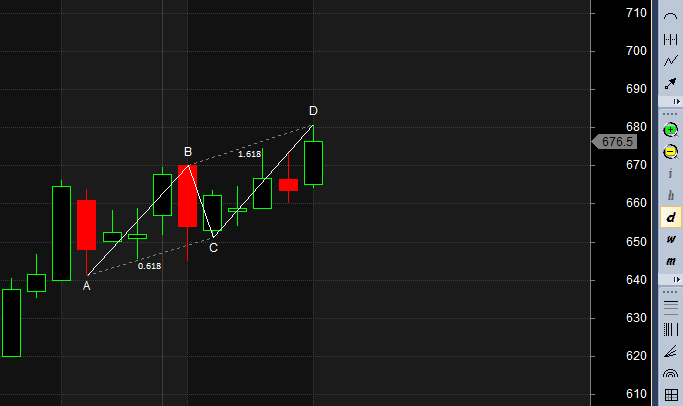
Positional Traders can use the below mentioned levels
Close below 672 Target 625
Intraday Traders can use the below mentioned levels
Buy above 684 Tgt 690, 696 and 702 SL 680
Sell below 672 Tgt 666,658 and 652 SL 677
SBI
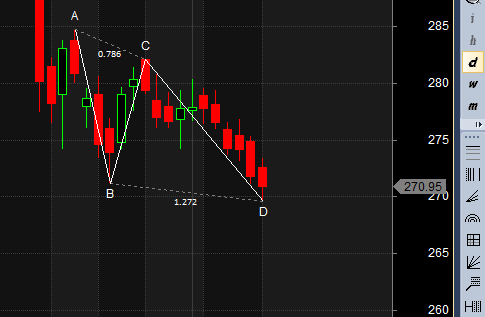
Positional Traders can use the below mentioned levels
Close above 273 Target 284/289
Intraday Traders can use the below mentioned levels
Buy above 272 Tgt 274, 276 and 279 SL 270.5
Sell below 269 Tgt 267,265 and 262 SL 274
How to trade Intraday and Positional Stocks Analysis — Click on this link
Performance sheet for Intraday and Positional is updated for August Month, Intraday Profit of 5.67 Lakh and Positional Profit of 5.64 Lakh. Please note we do not have any “ADVISORY Service”, I share this sheet to see how the system are performing and money can be made in Stock Market if System are followed with discipline. Also the performance differs from trader to trader.
http://tradingsystemperformance.blogspot.in/
http://stockpositionaltrading.blogspot.in/
- All prices relate to the NSE Spot/Cash Market
- Calls are based on the previous trading day’s price activity.
- Intraday call is valid for the next trading session only unless otherwise mentioned.
- Stop-loss levels are given so that there is a level below/above, which the market will tell us that the call has gone wrong. Stop-loss is an essential risk control mechanism; it should always be there.
- Book, at least, part profits when the prices reach their targets; if you continue to hold on to positions then use trailing stops to lock in your profits.
Follow on Facebook during Market Hours: https://www.facebook.com/pages/Bramesh
Follow on Twitter during Market Hours: https://twitter.com/brahmesh