


Bharat Financial
Positional Traders can use the below mentioned levels
Close Above 863 Target 898/932
Intraday Traders can use the below mentioned levels
Buy above 856 Tgt 863, 874 and 885 SL 850
Sell below 848 Tgt 840,830 and 820 SL 853
CESC

Positional Traders can use the below mentioned levels
Close Above 932 Target 953/966
Intraday Traders can use the below mentioned levels
Buy above 933 Tgt 940, 946 and 955 SL 927
Sell below 920 Tgt 910,898 and 888 SL 925
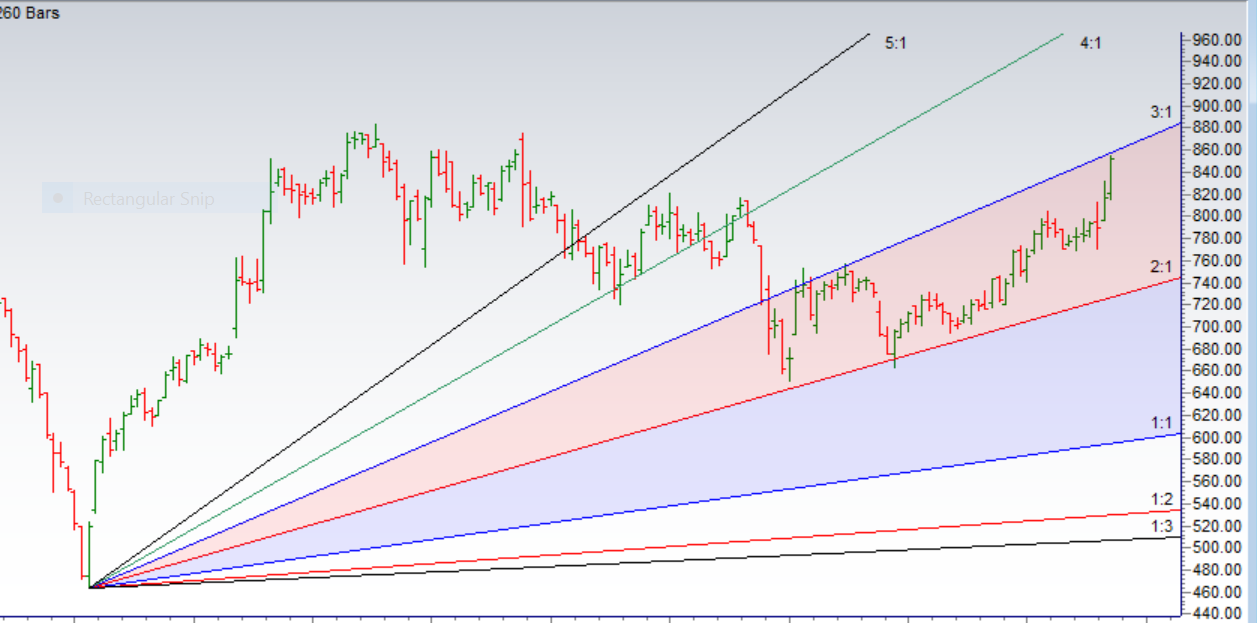
SRT Finance
![]()
Positional Traders can use the below mentioned levels
Close Above 972 Target 987/1008
Intraday Traders can use the below mentioned levels
Buy above 972 Tgt 978, 987 and 1000 SL 965
Sell below 960 Tgt 950,943 and 932 SL 965
How to trade Intraday and Positional Stocks Analysis — Click on this link
Performance sheet for Intraday and Positional is updated for July Month, Intraday Profit of 2.71 Lakh and Positional Profit of 5.46 Lakh. Please note we do not have any “ADVISORY Service”, I share this sheet to see how the system are performing and money can be made in Stock Market if System are followed with discipline. Also the performance differs from trader to trader.
http://tradingsystemperformance.blogspot.in/
http://stockpositionaltrading.blogspot.in/
- All prices relate to the NSE Spot/Cash Market
- Calls are based on the previous trading day’s price activity.
- Intraday call is valid for the next trading session only unless otherwise mentioned.
- Stop-loss levels are given so that there is a level below/above, which the market will tell us that the call has gone wrong. Stop-loss is an essential risk control mechanism; it should always be there.
- Book, at least, part profits when the prices reach their targets; if you continue to hold on to positions then use trailing stops to lock in your profits.
Follow on Facebook during Market Hours: https://www.facebook.com/pages/Bramesh
Follow on Twitter during Market Hours: https://twitter.com/brahmesh