


Using Woodies Pivot Points as Trading Strategy
As we have discussed above Pivot is the trend deciding level for a particular day so we can derive 3 basic rules for trading with pivots
- If the market/Stock trades above the pivot point then the bias for the day is on long side ie.Buying is advisable.
- If the market/stock trades below the pivot point then the bias for the day is for short side ie.Short Selling would be the preferred strategy.
- If the market opens, gap up or gap down and trade near R2, R3 or S2, S3, it will exhibit a tendency to trade back toward the Pivot. Thus, the general rule, ‘Avoid buying the High or selling the Low’.
- If either of S1 and R1 is penetrated, these breakout points will reverse their roles. ie.the first support S1 becomes the new resistance R1.
Let’s discuss the Pivot System with S&P 500 on 24th Sep 14 and how you could have traded that day using pivot points.
On 23rd Sep 2014 S&P 500 had the following:
High – 1995.41
Low – 1982.77
Close – 1982.77
Open for 24th Sep – 1983.34
This gave us the following Pivot Levels:
Pivot Point =1985.93
Resistance 1 =1989.09
Resistance 2 = 1998.57
Resistance 3 = 2001.73
Support 1 = 1976.45
Support 2 = 1973.29
Support 3 = 1963.81
Now Let’s see the 5 Min Chart of S&P 500 below on 24th Sep, 2014 and how could we trade using the Pivot Levels
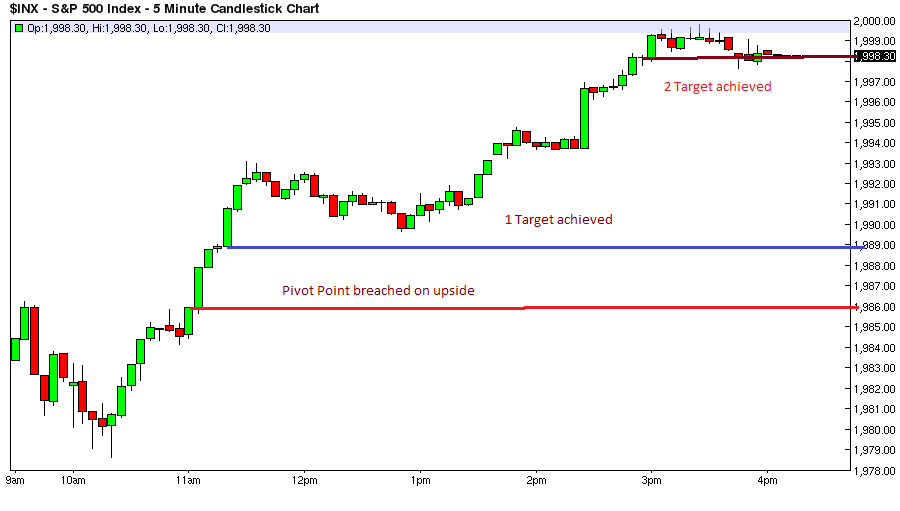
S&P 500 Opened at 1983.34 and immediately started going down. As per the Woodies Pivot Level System we take a long trade above Pivot ie.1986 Keeping Sl of 2 Points ie.1984.5
The first target for the trade is Resistance 1 ie.1989 , At this level a trader can either book profit or trail its position by keeping Sl at the entry price.
The second target for the trade is Resistance 2 ie. 1998. At this level a trader should book full profit. High made by S&P 500 on 24th Sep 2014 was 1999.79 just above the 2 resistance.
Let’s take another example of using Pivot levels to trade both Long and short trade
On 08/14/2014 AAPL had the following data:
High – 97.57
Low – 96.80
Close – 97.50
Open on 08th Aug 2014:97.90
This gave us the following Pivot Levels:
Pivot Point =97.34
Resistance 1 =97.88
Resistance 2 = 98.11
Resistance 3 = 98.65
Support 1 = 97.11
Support 2 = 96.57
Support 3 = 96.34
Now Let’s see the 5 Min Chart of AAPL below on 08th Aug 2014 and how could we trade using the Pivot Levels to trade both long side and short side.

AAPL opened gap up at 97.50 which is above pivot 97.34. As per the Pivot Level System we take a short trade below Pivot ie.97.34 Keeping Sl of as day’s high@ 97.9
The first target for the trade is Support 1 ie.97.11, At this level a trader can either book profit or trail its position by keeping Sl at the entry price ie 97.34.
The second target for the trade is Support 2 ie. 96.57. As seen from above Chart AAPL was unable to move near 2 target and started coming above 97.2 and eventually triggered the Sl.
Now as AAPL starts trading above Pivot level we can initiate a Long trade @ 97.4 SL 97 and target 1 being Resistance 1 97.88.
AAPL eventually reached 97.88 in last hour of trade and we booked profit.
Conclusion
Woodies Pivot Point levels are handy tools useful for day traders to know the potential market turning points. Pivots levels should never be used in isolation but a combination of Pivots levels with Candlestick pattern MACD,Stochastic crossovers can increase the probability of successful trade by giving a powerful buy and Sell signal.
sir in Indian markets which points usually helps in trading in nf and bnf…..? Classic ,Woodies or Camarilla Pivot Points ??
Everything works, You need to make sure strategy you plan to follow has been back tested for at least 1 year and suits your trading profile..