


Hind Petro

Positional/Swing Traders can use the below mentioned levels
Close above 810 Tgt 843/852
Intraday Traders can use the below mentioned levels
Buy above 810 Tgt 816,826 and 833 SL 806
Sell below 797 Tgt 789,780 and 769 SL 804
Just Dial
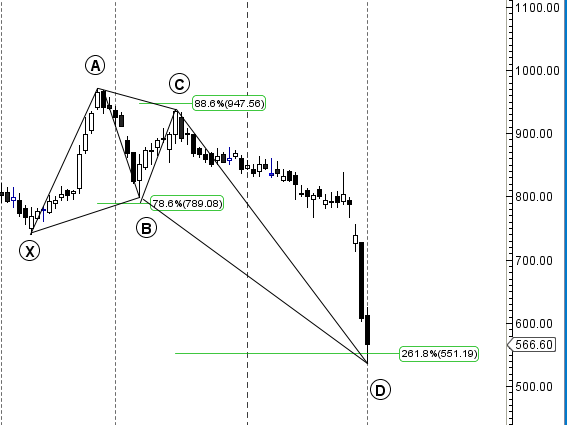
Positional/Swing Traders can use the below mentioned levels
Holding 551 Stock can bounce till 610/623/644
Intraday Traders can use the below mentioned levels
Buy above 576 Tgt 580,589 and 601 SL 570
Sell below 555 Tgt 548,542 and 536 SL 560
ICICI Bank
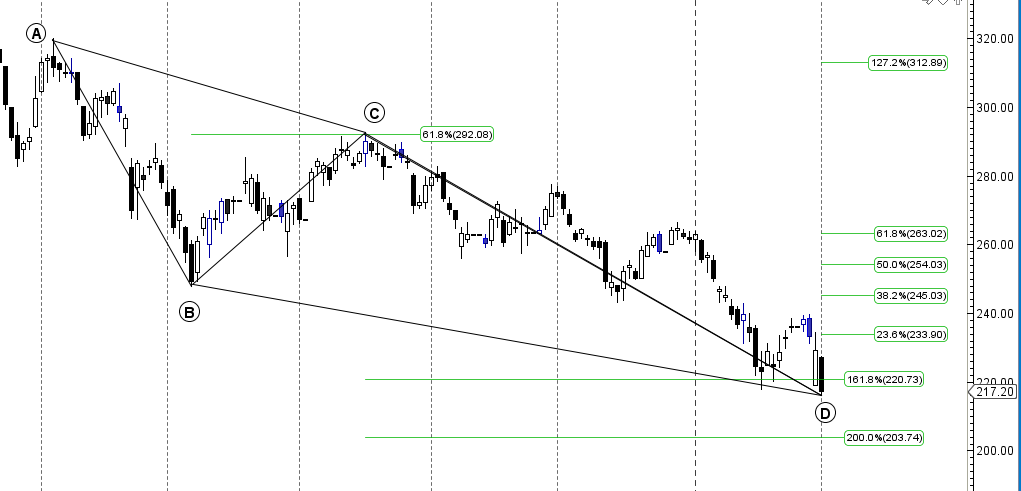
Positional/Swing Traders can use the below mentioned levels
Close above 220 Tgt 225/234
Intraday Traders can use the below mentioned levels
Buy above 220 Tgt 223,225 and 228 SL 218
Sell below 215 Tgt 213,210 and 208 SL 217
How to trade Intraday and Positional Stocks Analysis — Click on this link
Performance sheet for Intraday and Positional is updated for January Month, Intraday Profit of 3.57 Lakh and Positional Profit of 4.36 Lakh
http://tradingsystemperformance.blogspot.in/
http://stockpositionaltrading.blogspot.in/
- All prices relate to the NSE Spot/Cash Market
- Calls are based on the previous trading day’s price activity.
- Intraday call is valid for the next trading session only unless otherwise mentioned.
- Stop-loss levels are given so that there is a level below/above, which the market will tell us that the call has gone wrong. Stop-loss is an essential risk control mechanism; it should always be there.
- Book, at least, part profits when the prices reach their targets; if you continue to hold on to positions then use trailing stops to lock in your profits.
Follow on Facebook during Market Hours: https://www.facebook.com/pages/Brameshs-Tech/140117182685863
Follow on Twitter during Market Hours: https://twitter.com/brahmesh
Bramesh, thank you for providing tips everyday. Could you highlight the best pick out of 3 while posting the tips itself?