


Last Week we gave Chopad Levels of 7376 , Nifty gave short entery on Monday which got stopped out on Tuesday, and Traders were able to Intitate long which moved till 1 Tgt of 7457 High made was 7462. Shorts were again triggered on Wednesday Open and Did 2 target on downside @7450, Low made was 7241. So Both High and Low was made near our Chopad levels. Lets analyses how to trade nifty next week as we have Trading Holiday on Tuesday on Account of Republic Day.
Traders should work on New Year resolutions and use the below 2 post for planning a successful and profitable 2016.
Traders’ Resolutions for New Year-2016
New Year Resolutions for Trading Success
Nifty Hourly Chart

As discussed in last analysis Break of 7420 can see fast move till 7290. Close above 7420 again a move towards 7610.
Nifty moved perfectly in pyrapoint angles break support at 360 line, and saw a quick fall till 405 and bounced back again to stop at 360.
Coming week break of 7435, can see move towards 7571 and unable to do so can see move towards 7290.
Nifty Harmonic

Now Nifty is forming an ABCD pattern which gets completed around 7221 as shown in above chart.
Nifty made low of 7242 thus completing the ABCD pattern, Now coming week close above 7433 can see Nifty moving towards 7470/7521
Nifty Gann Angles

As discussed in last week Gann angles are shown above as shown we can see move till blue line.
Nifty bounced exactly from gann angles. Holding 7240 we can see move till 7550/7607.
Nifty Supply and Demand

Self explanatory chart of Weekly Supply and Demand zone is shown,Weekly close below 7563 can see moving towards 7118 levels.We have seen low of 7221,But now bulls needs to see close 7563 to be out of bear clutches.
Nifty Gann Date
Nifty As per time analysis 25/29 Jan is Gann Turn date , except a impulsive around this dates. Last week we gave 18/20 Jan Nifty saw a volatile move.
Nifty Gaps
For Nifty traders who follow gap trading there are 15 trade gaps in the range of 7000-9000
- 7067-7014
- 7130-7121
- 7276-7293
- 7229-7239
- 7454-7459
- 7963-7937
- 7741-7675
- 8327-8372
- 8937-8891
- 8251-8241
- 8232-8209
- 8116-8130
Fibonacci technique
Fibonacci Retracement
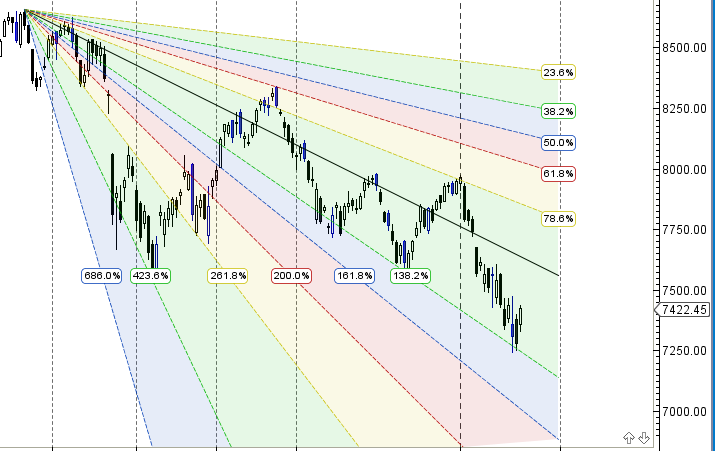
7414/7520/7607 are levels to be watched in coming week.
Nifty Weekly Chart

It was negative week, with the Nifty down by 15 points closing @7422 forming DOJI candlestick unable to cross above the middle trendline as shown in above chart and closing below its 20/ 55/100 WEMA.
Trading Monthly charts

Monthly chart broke support @61.8 % on Monthly charts.
Nifty PE

Nifty PE @20 lowest from Oct 2014.
Nifty Weekly Chopad Levels
Nifty Trend Deciding Level:7457
Nifty Support:7380,7328,7285
Nifty Resistance:7506,7555,7607
Levels mentioned are Nifty Spot
Let me go by Disclaimer these are my personal views and trade taken on these observation should be traded with strict Sl.Please also read the detailed Disclaimer mentioned in the Right side of Blog.
Want to see post in your Inbox,Register by adding your email id in Post in your Inbox section
Follow on Facebook during Market Hours: https://www.facebook.com/pages/Brameshs-Tech/140117182685863
Follow on Twitter during Market Hours: https://twitter.com/brahmesh
CHOPAD HAS BECOME MY HELIPAD FOR SAFE TAKE-OFF & LANDING.
THANKS BRAMESHJI