


Introduction
Fibonacci numbers were derived from an Italian mathematician Leonardo Pisano. Fibonacci was a mathematician who was born in Italy around the year 1170. It is believed that Mr. Fibonacci discovered the relationship of what are now referred to as Fibonacci numbers while studying the Great Pyramid of Gizeh in Egypt.
What are Fibonacci numbers ?
Fibonacci numbers are a sequence of numbers in which each successive number is the sum of the two previous numbers:
1, 1, 2, 3, 5, 8, 13, 21, 34, 55, 89, 144, 610, etc.
As per classic technical analysis that certain percentages of the Fibonacci Sequence (after the first several numbers) identified that the ratio of any number to the next was approximately 0.618% and the next lower number was 1.618%.Active Traders and investors used these numbers in their trading and provide exceptional turning points within the market.
There are three popular Fibonacci studies:
- Fibonacci arcs.
- Fibonacci fans.
- Fibonacci retracements and extension.
The above 3 studies helps in predicting the change in trend as prices for stocks commodity and currency near the lines created by the Fibonacci studies.
Fibonacci Arcs
Fibonacci arcs mark potential support or reversal zones to watch as prices pullback after the advance. The interpretation of Fibonacci Arcs involves anticipating support and resistance as prices approach the arcs. After a decline, Fibonacci Arcs are used to anticipate resistance or reversal zones for the counter-trend bounce.
Fibonacci Arcs are half circles that extend out from a trend line. The first and third arcs are based on the Fibonacci ratios .382 (38.2%) and .618 (61.8%), respectively. The middle arc is set at .50 or 50%.
Fibonacci Arcs are drawn using a trend line between two extreme points, for example, a swing High and swing low. Three arcs are then drawn, centred on the second extreme point, so they intersect the trend line at the Fibonacci levels of 38.2%, 50.0%, and 61.8%.
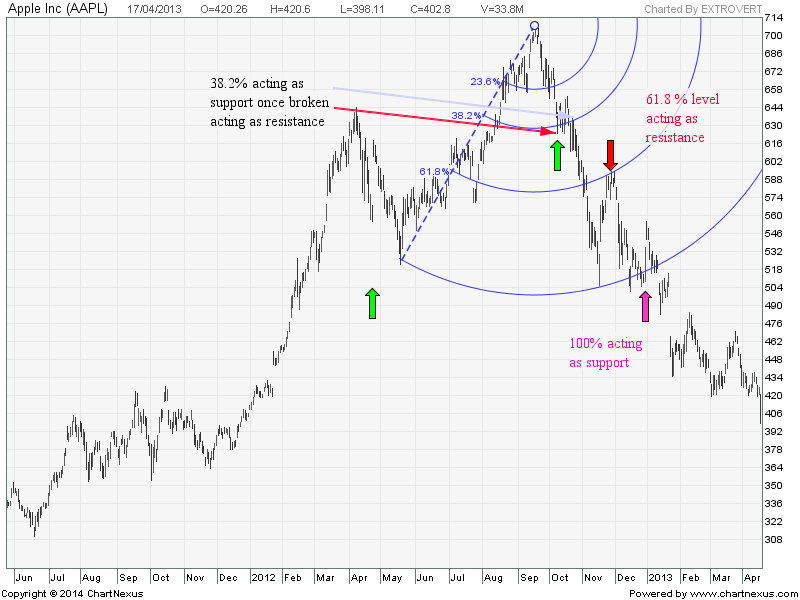
Let’s explain the concept of Fibonacci arcs using Apple Inc example
As seen in below chart of Apple, after the significant bull market, from low of 522 on 18th May 2012 till the high of 704 on 21st Sep 2012 Apple stock started correcting, as discussed above we will use the low and high to draw Fibonacci arcs as shown in below chart.
The correction first stopped at 38.2% retracement gave a small pullback and again started with its correction near the next Fibonacci arc at 61.8%, where price met support. The 61.8% arc retracement acted as temporary support.
After price broke through the temporary support arc at 61.8%, price moved down, The prior resistance level at 61.8%, after being broken, became a new resistance level. Prices unable to cross 61.8%, after several attempts moved to the next significant Fibonacci ratio, 100%, where it found a new support level.

Fibonacci Fans
Fibonacci Fan Lines are displayed by drawing a trend line between two extreme points, which are basically swing high and swing low of recent move. Then an “invisible” vertical line is drawn through the second extreme point. Three trendline are then drawn from the first extreme point so they pass through the invisible vertical line at the Fibonacci levels of 38.2%, 50.0%, 61.8% and 78.6%.These fan lines can then be used to estimate support levels or potential reversal zones. Fibonacci Fans are used to measure the speed of a trend’s movement, higher or lower.
The following chart of S&P 500 shows how prices found support and resistance at the Fan Lines.

As seen in above chart as soon as S&P 500 prices move below a Fibonacci Fan trendline, then price is usually expected to fall further until the next Fibonacci Fan trendline level; therefore, Fibonacci Fan trendlines are expected to serve as support for uptrending markets.
The chart above of the S&P 500 shows an uptrend that retraced to the 38.2%,50% and 61.8% Fibonacci Fan marked by Blue circles.
Let’s discuss one more example to discuss how trades can be taken based on Fibonacci fans.

Euro USD currency pair Daily chart has been shown above. As seen Long trades can be initiated once prices touched 50% retracement level and drop near 38.2% retracement level, As soon as price drops near 38.2% a low risk entry is taken with a SL of close below 38.2% line and target of 50% and 61.8% line. The target got achieved subsequently as seen in above chart.
Fibonacci Retracements and Extension
Fibonacci Retracements and Extensions are displayed by first drawing a trend line between two extreme points, which usually are swing high and swing low of recent move. A series of eleven horizontal lines are drawn intersecting the trend line at the Fibonacci levels of 0.0%, 23.6%, 38.2%, 50%, 61.8%, 78.6%, 100%, 123.6%,138.2%, 150%, and 161.8%.
After a significant price move (either up or down), prices will often retrace a significant portion (if not all) of the original move. As prices retrace, support and resistance levels often occur at or near the Fibonacci Retracement levels.
Fibonacci extensions work best when stocks are at new highs or new lows – where there aren’t any obvious support or resistance levels on the chart. So, if you are long a stock and it begins to make new highs, and you want to take profits, you can calculate the extension levels to get a general idea of where it may begin to fall.
Let’s discuss both Fibonacci retracement and Fibonacci extension with examples
In the following chart of Gold on 5 minuted time frame, Fibonacci Retracement lines were drawn between $1334 and $1341.5 which were swing high and swing low.

The rally from the lowest low ($1334) to the high ($1341.5) was a difference of $7.5. The most common Fibonacci ratios are 0.382, 0.50 and 0.618, which allows us to calculate the key Fibonacci support levels.
38.2% Support: $1341.5 – (0.382 x $7.5) = $1338.6
50% Support: $1341.5 – (0.50 x $7.5) = $1337.5
61.8% Support: $1341.5 – (0.618 x $7.5) = $1336.8
As a result, those who went short once gold was unable to break swing high for 15 mins could have used a stop at swing high of 1341.5, for target of 38.2%, 50% and 61.8% respectively. As seen above shorts all 3 target got achieved.
Fibonacci extension example is discussed on CNX Nifty. Indian Index have breached there all time high of 6415 on 7th march 2014 and Index moved up, traders long could have used the Fibonacci extension to get the next target. As seen below Index next day made exact high at 123.6% retracement.

Conclusion
Fibonacci studies are used to identify potential support, resistance or reversal points. No indicator is perfect. This is why chartists must use other tools to confirm support, resistance, bullish reversals and bearish reversals.
Thank you for posting such an informative article!!
Thanks bramesh ji , very usefull article ..
Thanks bramesh , very usefull.
CONCLUDE WITH THE CONCLUSION OF THE ARTICLE
NO INDICATOR IS PERFECT
NICE ARTICLE ! WELL WRITTEN .
Excellent !!
Last few lines are important : Other tools to confirm support and resistance .
Sirji : Very well written on price correction , Please throw some light on Time correction, So the usage of Fib along with other tools becomes more efficient .