


SAIL
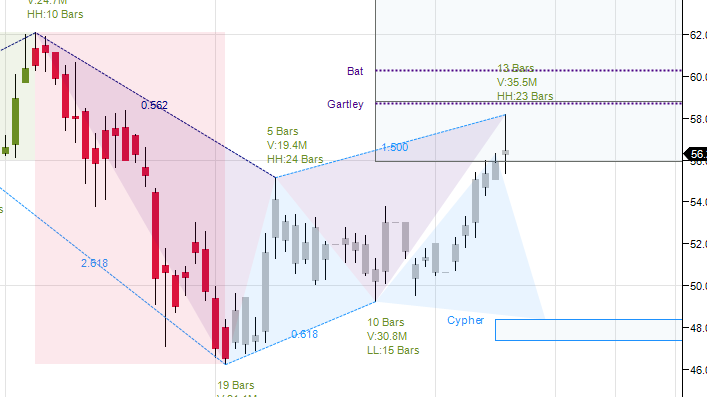
Positional/Swing Traders can use the below mentioned levels
Close below 55 Tgt 53/50
Intraday Traders can use the below mentioned levels
Buy above 56.6 Tgt 57.8,59.3 and 60 SL 56
Sell below 55.8 Tgt 55,53.7 and 52.2 SL 56.4
CESC
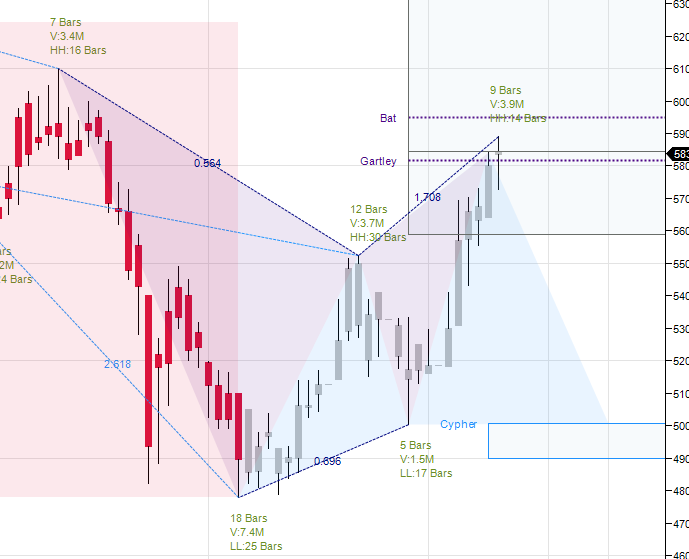
Positional/Swing Traders can use the below mentioned levels
Close below 576 Tgt 555
Intraday Traders can use the below mentioned levels
Buy above 584 Tgt 588,592 and 596 SL 581
Sell below 580 Tgt 575,568 and 564 SL 583.5
Auro Pharma
Intraday Traders can use the below mentioned levels
Buy above 791 Tgt 801,814 and 825 SL 782
Sell below 775 Tgt 766,755 and 744 SL 782
How to trade Intraday and Positional Stocks Analysis — Click on this link
Performance sheet for Intraday and Positional is updated for September Month, Intraday Profit of 1.84 Lakh and Positional Profit of 1.93 Lakh
http://tradingsystemperformance.blogspot.in/
http://stockpositionaltrading.blogspot.in/
- All prices relate to the NSE Spot/Cash Market
- Calls are based on the previous trading day’s price activity.
- Intraday call is valid for the next trading session only unless otherwise mentioned.
- Stop-loss levels are given so that there is a level below/above, which the market will tell us that the call has gone wrong. Stop-loss is an essential risk control mechanism; it should always be there.
- Book, at least, part profits when the prices reach their targets; if you continue to hold on to positions then use trailing stops to lock in your profits.
Follow on Facebook during Market Hours: https://www.facebook.com/pages/Brameshs-Tech/140117182685863
Please also read the detailed Disclaimer mentioned in the Right side of Blog.
Sir bank nifty and nifty gann dates given were 12,13 oct resp.. any changes to it?