


Last week we gave Chopad Levels of 8550 , Nifty did 3 target on downside rewarding chopad followers. Lets analyze how to trade market in coming week.
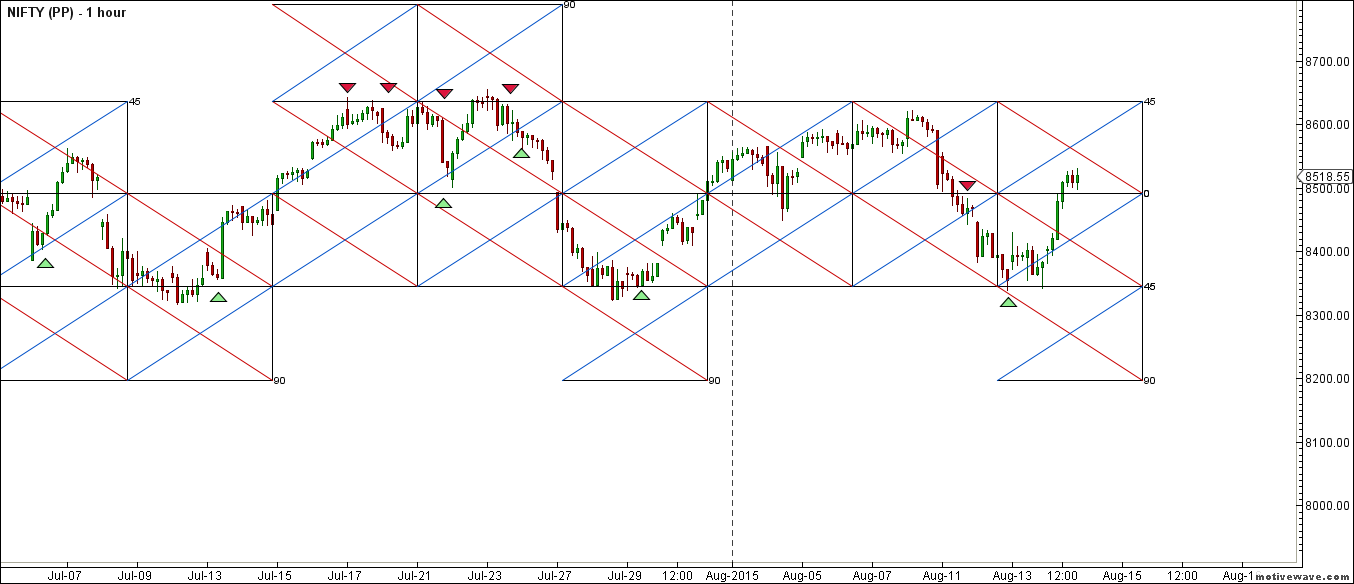
Nifty Hourly Chart

Nifty hourly chart with gann box is shown above, breakout comes above 8550 8×1 line and support exits near 2×1 degree gann line around 8450/8440 odd levels. Gann Box again helped in identifying the bottom.
Nifty Pyrapoint Analysis
Again took support and bounced back, Again heading towards the crucial resistance zone of 8636.One of the wonderful tool for traders.
Nifty Gunner

Nifty is getting resisted at red arc corrected, took support near gann line and bounced back as shown in above chart, Heading towards 8600 where price action needs to be watched.
Nifty Gann Box

Gann Box on daily chart is shown above suggesting resistance in range of 8590/8600 levels.Strong support at 2×1 line at 8350.
Nifty Supply and Demand
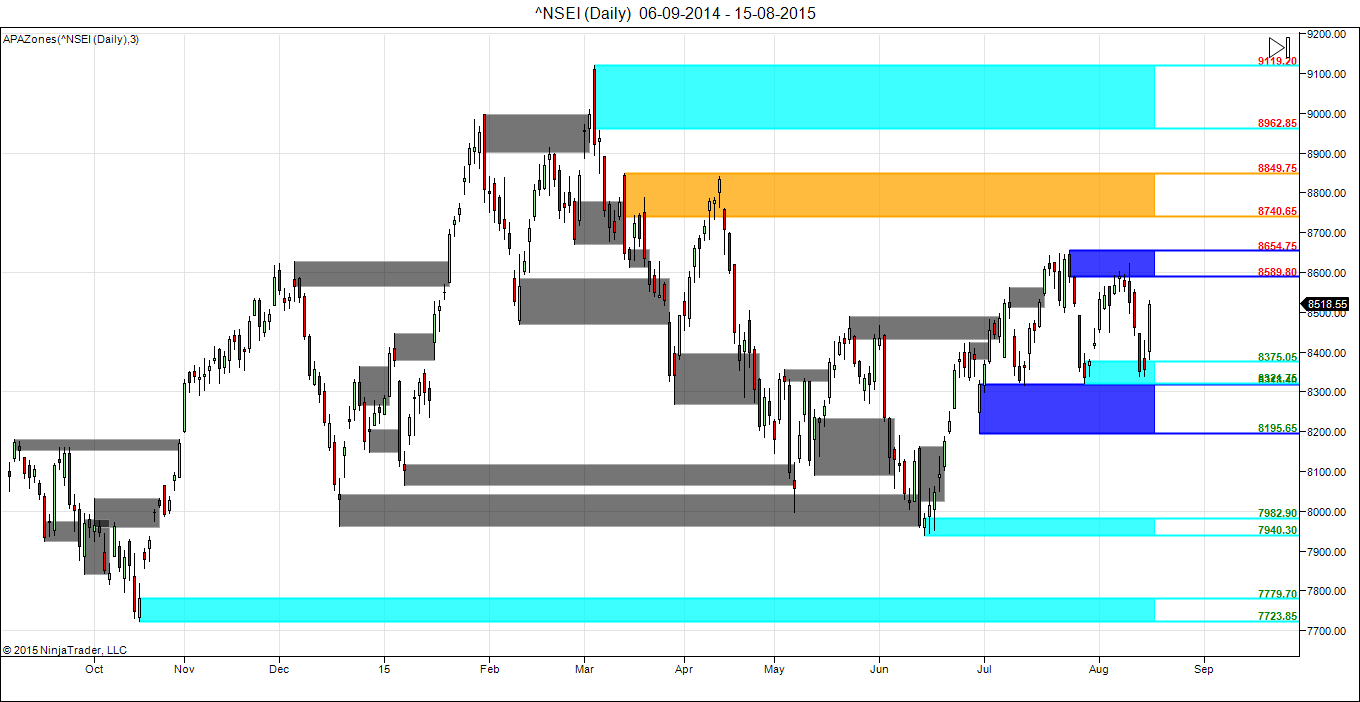
Nifty rotated between Supply and Demand zone and rewarding traders who shorted at Demand zone and bought back at supply zone. Self Explanatory chart shown above.
Elliot Wave Analysis

Have been advocating use dips to buy quality stocks.
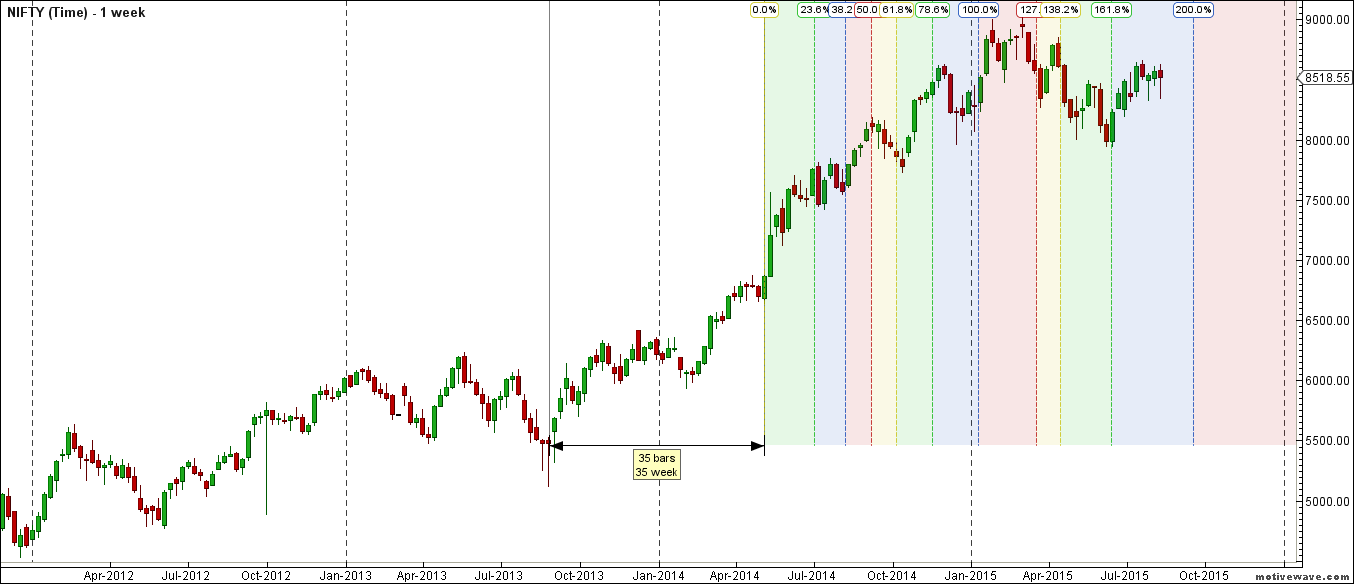
Nifty Gann Date
Nifty As per time analysis 19 August/21 August is Gann Turn date , except a impulsive around this dates. Last week we gave 11 August/14 August Nifty saw a volatile move .
Nifty Gaps
For Nifty traders who follow gap trading there are 15 trade gaps in the range of 7000-9000
- 7067-7014
- 7130-7121
- 7276-7293
- 7229-7239
- 7454-7459
- 7526-7532
- 7598-7568
- 7625-7654
- 7780-7856
- 7927-7940
- 8174-8195
- 8091-8102
- 8355-8381
- 8937-8891
Fibonacci technique
Fibonacci fan

38.2% again added as support and 61.8% as resistance as shown above.

8500/8527/8652/8665/8845 is fibo retracement as shown above are important level to be watched in coming week
Nifty Weekly Chart

It was negative week, with the Nifty down by 45 points closing @8518 forming hammer candlestick pattern , and closing above its 20/55 WEMA and bounced from its trendline support as shown in above chart. We are still in Bullish time cycle from 14 June till mid September, correction in between should be bought into with proper risk management.
Trading Monthly charts
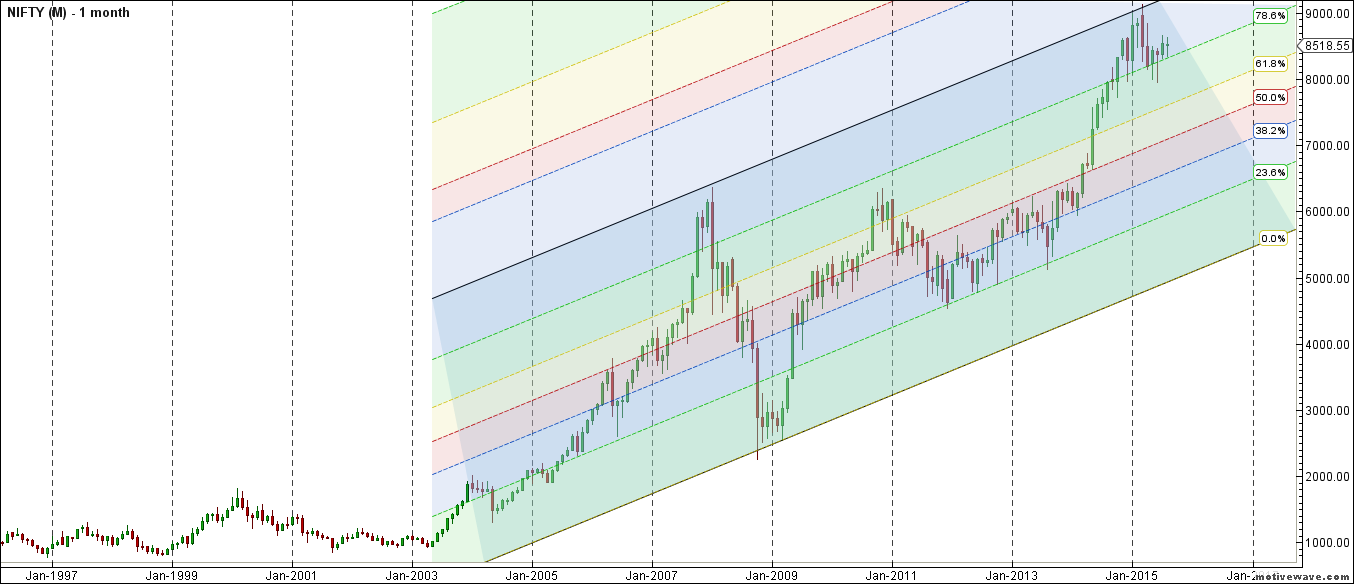
Monthly chart after 2 Month of hammer candlestick,saw a bullish candlestick, and again nifty took support @78.6 % if low held we should see nifty moving above 8650.
Nifty PE
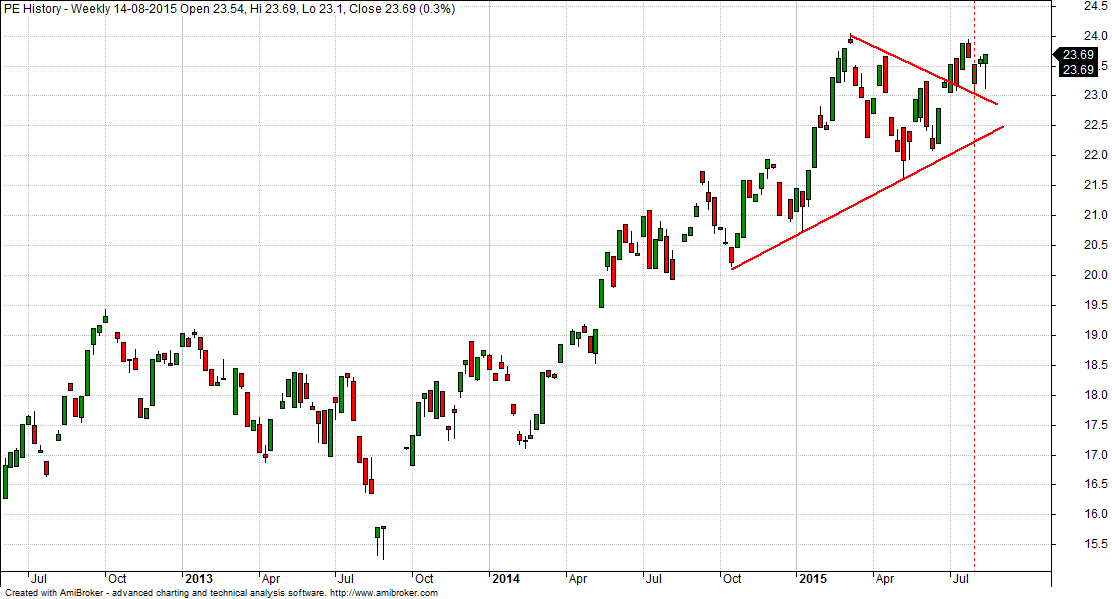
Nifty PE @23.69 , results have not been so great to justify such rich valuation.
Nifty Weekly Chopad Levels
Nifty Trend Deciding Level:8546
Nifty Resistance:8610,8650,8775
Nifty Support:8490,8420,8360
Levels mentioned are Nifty Spot
Let me go by Disclaimer these are my personal views and trade taken on these observation should be traded with strict Sl.Please also read the detailed Disclaimer mentioned in the Right side of Blog.
Want to see post in your Inbox,Register by adding your email id in Post in your Inbox section
Follow on Facebook during Market Hours: https://www.facebook.com/pages/Brameshs-Tech/140117182685863
Nifty As per time analysis 19 August/21 August is Gann Turn date , except a impulsive around this dates. …………. so true ,,,,,, about 200 points down
Fii are nett saler in cash nd index so this week will sideways not cross 8650 nd not breck 8335 but in indusval stock will b to much hamring in mkt now big player have captur mkt they are also traping fii or nse fii datta is wrong
There are 5 to 6 technical indicators and analysis and all are not getting right ….one at a time …it means all rest or wrong…so what is great about this? Dear brahmesh…all indicators are not getting right at a time …so its all uncertain…you don’t know next time which one will be right
Studies are done to catch all aspect of trading pattern at current juncture, With all the studies we come to chopad levels which are used to trade, For us trading is done on levels.
Rgds,
Bramesh
Sachin, its very clear from charts they are poised upwards… that’s what the weekly analysis says…
Follow one methodology and stick to it.
Rgds,
Bramesh
How will be Monday opening red or green
Amazing analysis, your analysis covered from all the perspectives. Very well explained…Hats off to you…
Overhang of Parliament paralysis gets over on 13 august with close of monsoon session. Markets absorbed all bad news from domestic front and global front and given a very positive close on Friday. If this momentum gets continued we can see Nifty hitting 8800 levels very soon.
Amazing dedication towards markets.. Your passion makes an you an unique mkt person.. You surely are born for just mkts.. Kudos to you!!
Thanks All for your comments and feedback. Appreciated
Rgds,
Bramesh