


Last week we gave Chopad Levels of 8173 , Nifty opened with Huge gap down and did not give any opputunity for Chopad Followers to take entry. Lets analyze how to trade market in coming week.
Nifty Hourly EW Chart

Nifty hourly chart as per EW analysis if its moving in abc fashion can see up move till 8277 before next round of downmove. Crossing Fridays high will play crucial role.
Nifty Gann Box

Gann Box on daily chart is shown above suggesting resistance in range of 8200 levels.Strong support at 4×1 line at 7960 levels,below than further downmove can be seen.
Nifty Supply and Demand
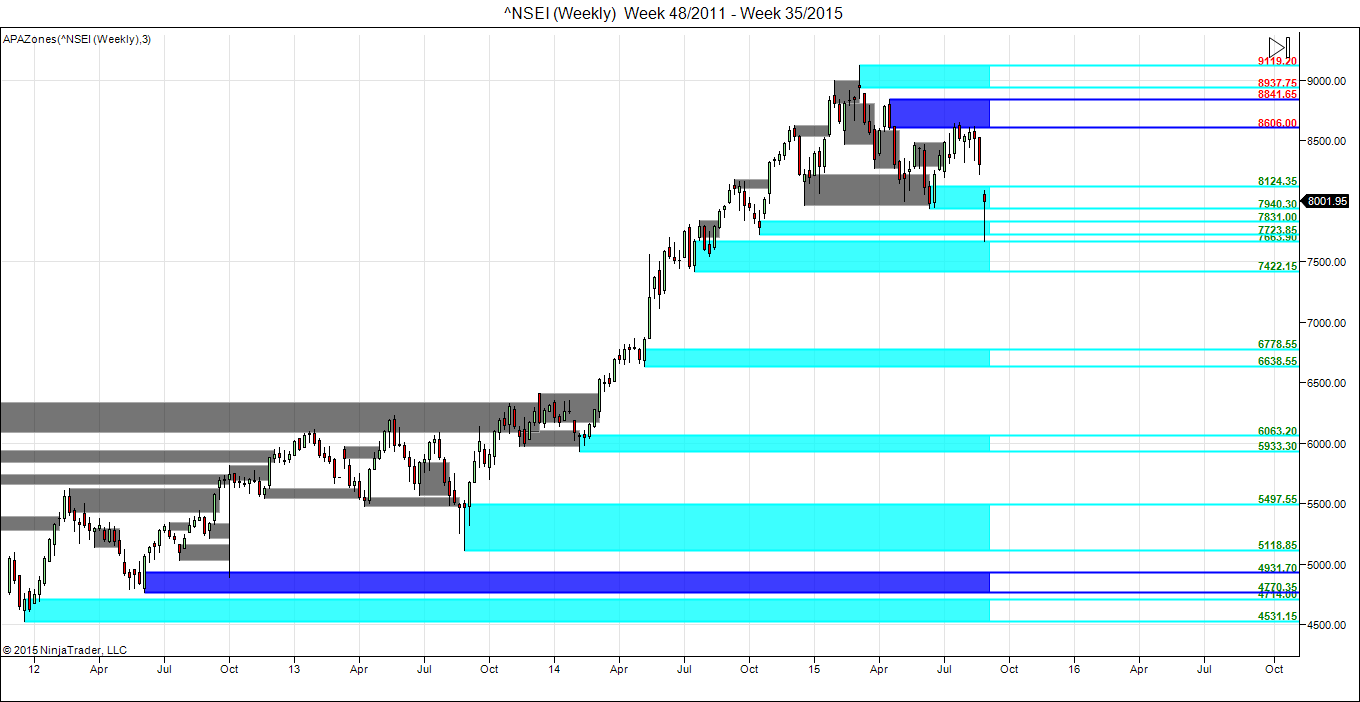
8124 is where demand zone starts and 7940 is where supply zone is established.
Nifty Harmonic Analysis
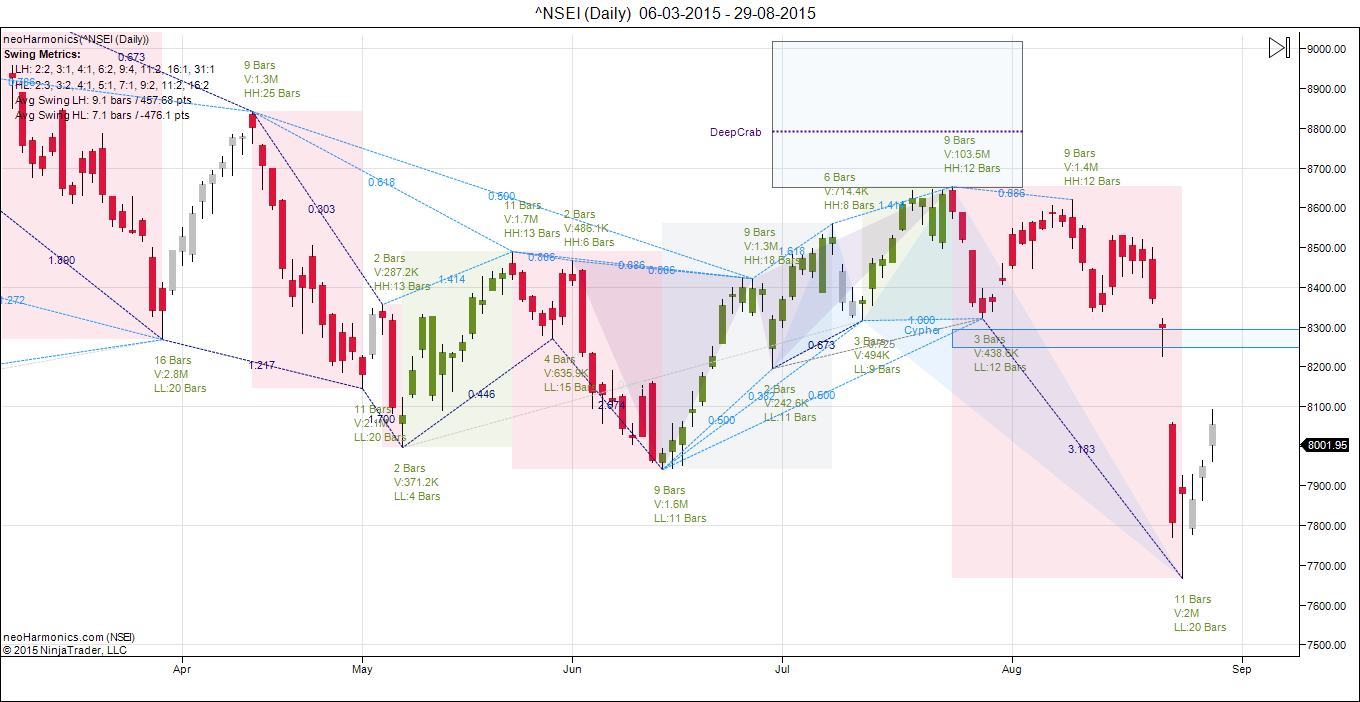
Nifty as per Harmonic Analysis has formed BAT pattern which was used to establish short term bottom and nifty rallied almost 400 points from the lows. 8200 is where we need to see price action above Friday high of 8091.
Nifty Daily EW

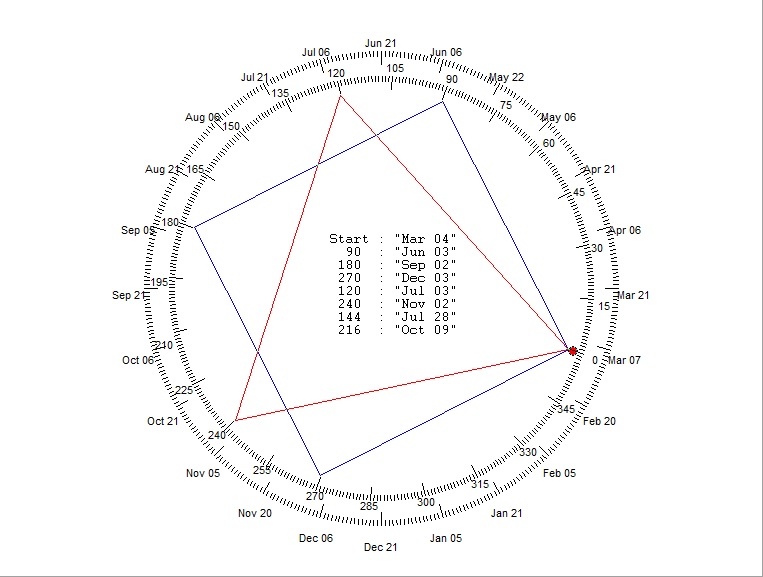
Nifty Gann Date
Nifty As per time analysis 31 August/04 September is Gann Turn date , except a impulsive around this dates. Last week we gave 24August/27 August Nifty saw a volatile move .
Gann Emblem
Nifty Gaps
For Nifty traders who follow gap trading there are 15 trade gaps in the range of 7000-9000
- 7067-7014
- 7130-7121
- 7276-7293
- 7229-7239
- 7454-7459
- 7526-7532
- 7598-7568
- 7625-7654
- 7780-7856
- 7927-7940
- 8174-8195
- 8091-8102
- 8322-8372
- 8355-8381
- 8937-8891
Fibonacci technique
Fibonacci fan
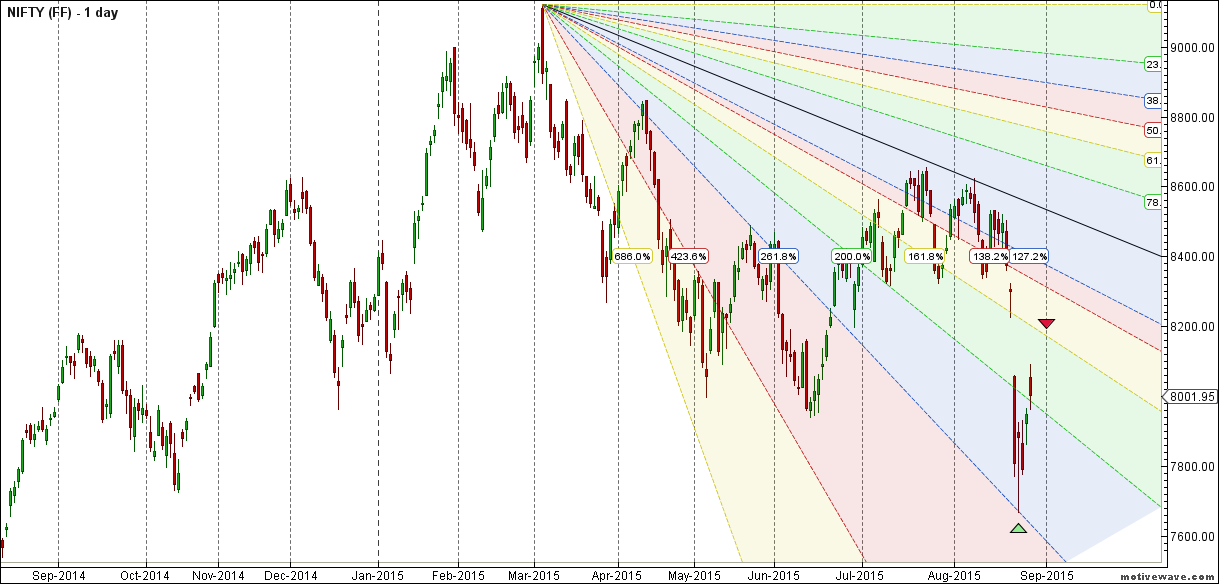
200% again will act as support and 161.8% act as resistance as shown above.
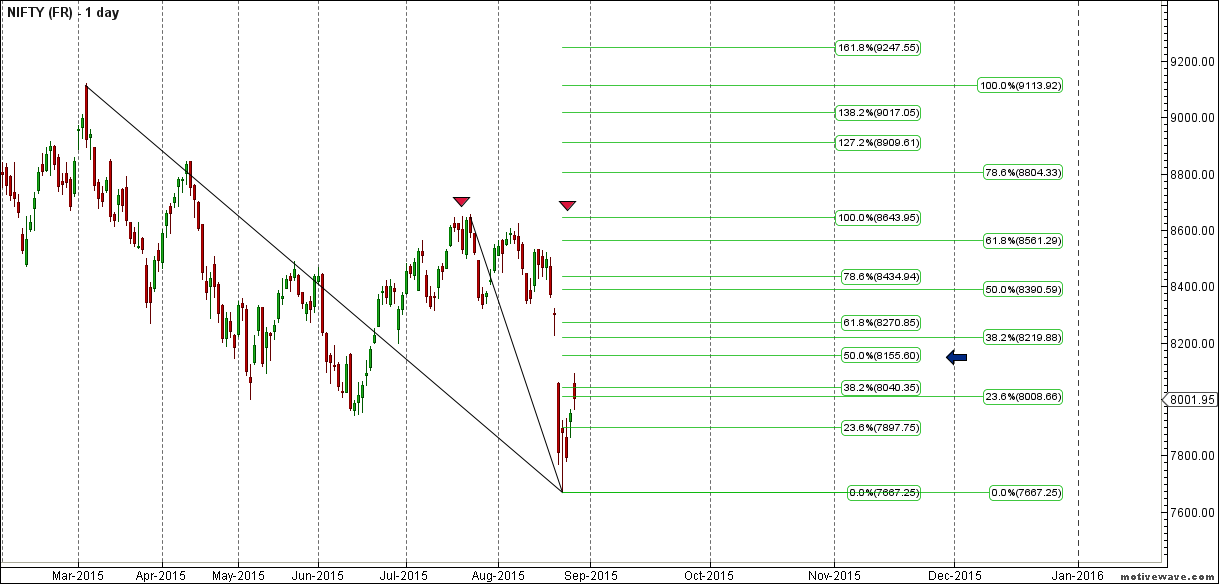
8154/7897 is fibo retracement as shown above are important level to be watched in coming week
Nifty Weekly Chart

It was negative week, with the Nifty down by 298 points closing @8001 forming hammer candlestick pattern , and closing below its 55 WEMA and 20 WEMA and held its trendline support as shown in above chart. We are still in Bullish time cycle from 14 June till mid September, correction in between should be bought into with proper risk management.

Trading Monthly charts

Monthly chart took support @61.8% retracement line and showed bounce back.
Nifty PE

Nifty PE @22.17 , so atlast seeing some correction in valuation
Nifty Weekly Chopad Levels
Nifty Trend Deciding Level:8026
Nifty Resistance:8090,8170,8250
Nifty Support:7920,7860,7777
Levels mentioned are Nifty Spot
Let me go by Disclaimer these are my personal views and trade taken on these observation should be traded with strict Sl.Please also read the detailed Disclaimer mentioned in the Right side of Blog.
Want to see post in your Inbox,Register by adding your email id in Post in your Inbox section
Follow on Facebook during Market Hours: https://www.facebook.com/pages/Brameshs-Tech/140117182685863
Why bother to read a forum if you dont like it?
Mr Soni, Fii are smart they have bought futures and sold cash markets bought puts and sold calls.
Nifty spot 8200-8220 is LOC for bears. Nifty Weekly chart pattern made Head and shoulder but not closed below 7940 on weekly closing. Looks like Nifty range for next one month is 7500-8200.Lots of stock portfolio can get damaged if markets trades in this range for upcoming month.
Heavy buying in nifty futures by fii’s does state that nifty will go to 8250 to 8300 on monday ?