


Last week we gave Chopad Levels of 8221 , Nifty did 2 target on downside and 2 target on upside rewarded Chopad followers on both sides. Few readers have raised a flag stating i give both side views, hope last week move have answered their question why we need to be prepared with both side of market moves as trading is all about probability and as a trader you need to be prepared for any move. Lets analyze how to trade market in coming week.
Nifty Hourly Chart

Nifty Hourly charts has broken on upside and above its 21/34 EMA, till 8164 is not broken hourly trend remains on upside. Trend line resistance comes @8375.
Nifty Hourly Elliot Wave Chart
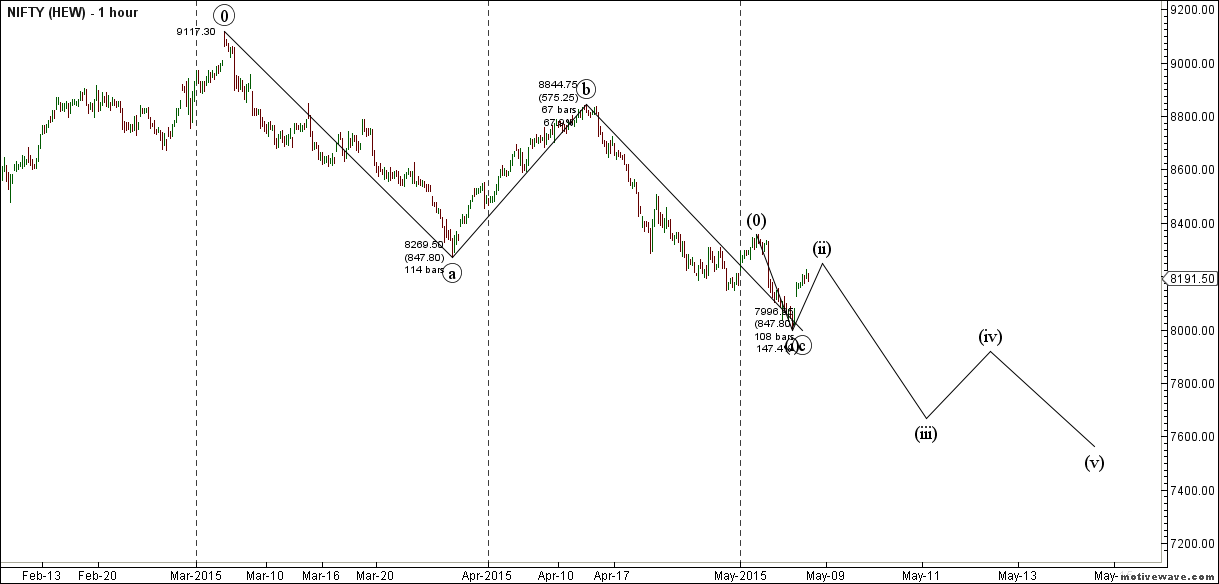
Hourly charts has completed its ABC correction now 8247 and 200 SMA @8282 will play a vital role in coming week. Unable to close above 200 DMA, the second EW view can come into effect.
Nifty Pyrapoint Analysis
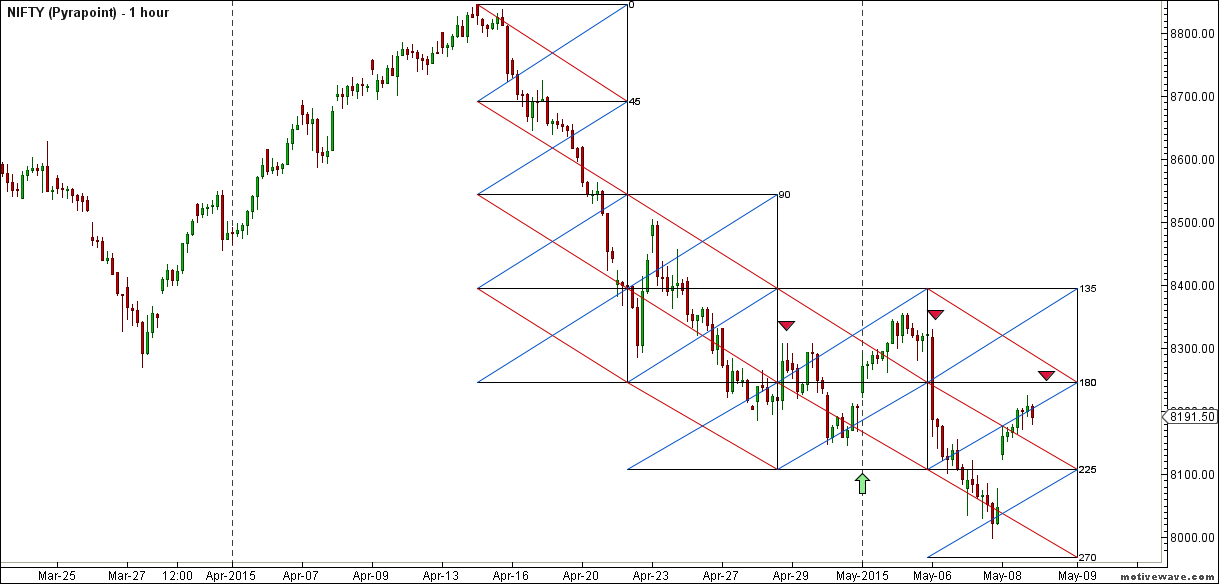
As per Pyrapoint Analysis unable to sustain above its 180 degree line, suggesting move towards its 225 degree line which lies near 8105.Able to sustain above it can see it moving towards @8395.
Nifty Market Profile

Nifty as per Market profile 8200 should be closely watched in coming week,unable to cross we can see downside till 7896 odd levels.Above 8200 target comes @8412.
Nifty Andrew Pitchfork
Holing the median line suggests bulls have upper hand.
Nifty Gunner
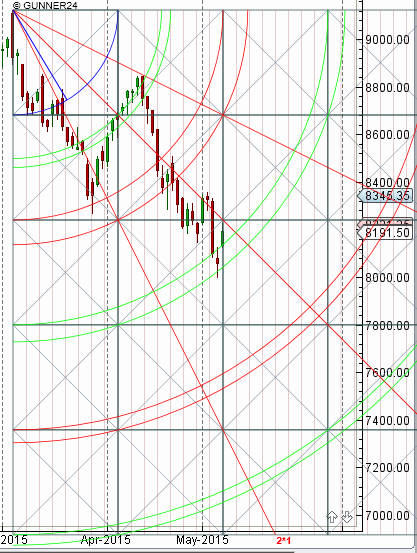
ON Daily chart Nifty Gunner is entering in gann line , unable to cross above it can see nifty revisiting the lows and make new low. Closing above it can see it moving towards 8375/8400 odd levels.
Nifty Harmonic
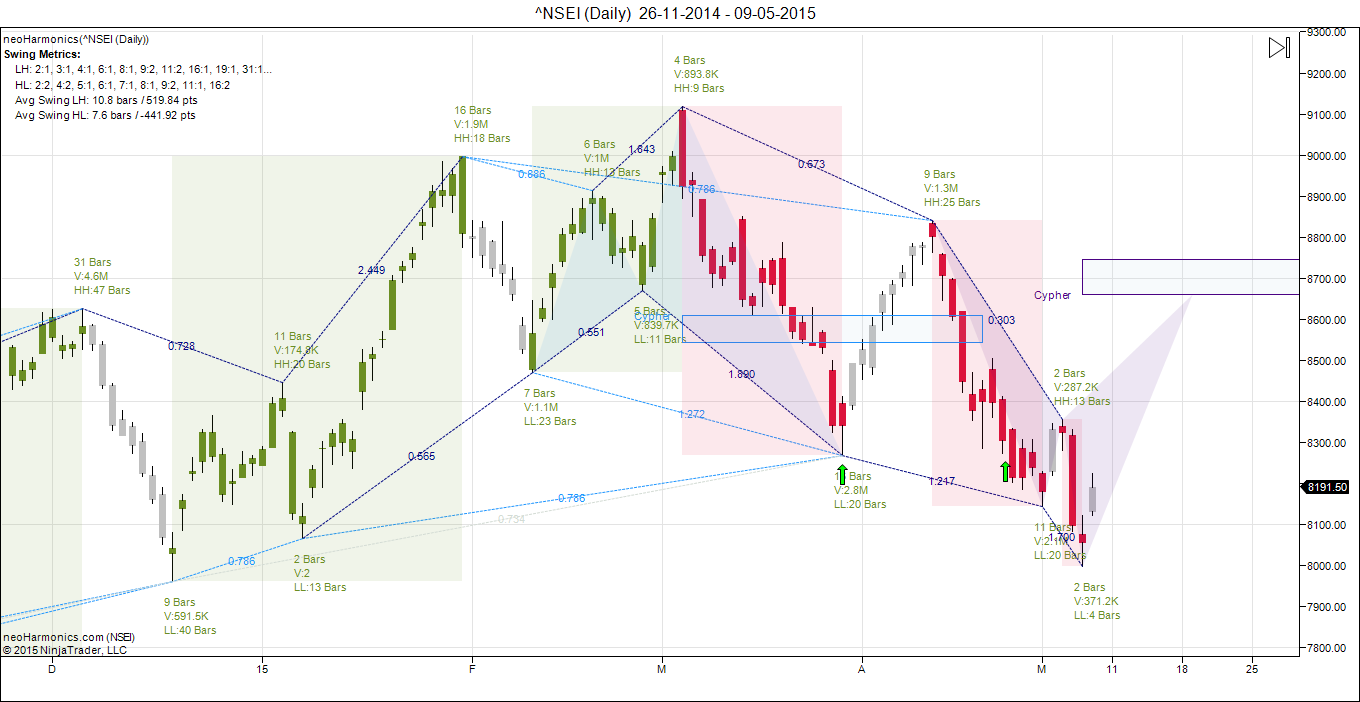
If butterfly pattern needs to form Nifty should bounce sharply in coming week till 8400/8600.
Nifty Daily Elliot Wave Chart

As per EW more legs are left to the rally use dips around 8000/7900 to take exposure to quality large and mid caps stocks. NO leveraged positions this for cash market traders.
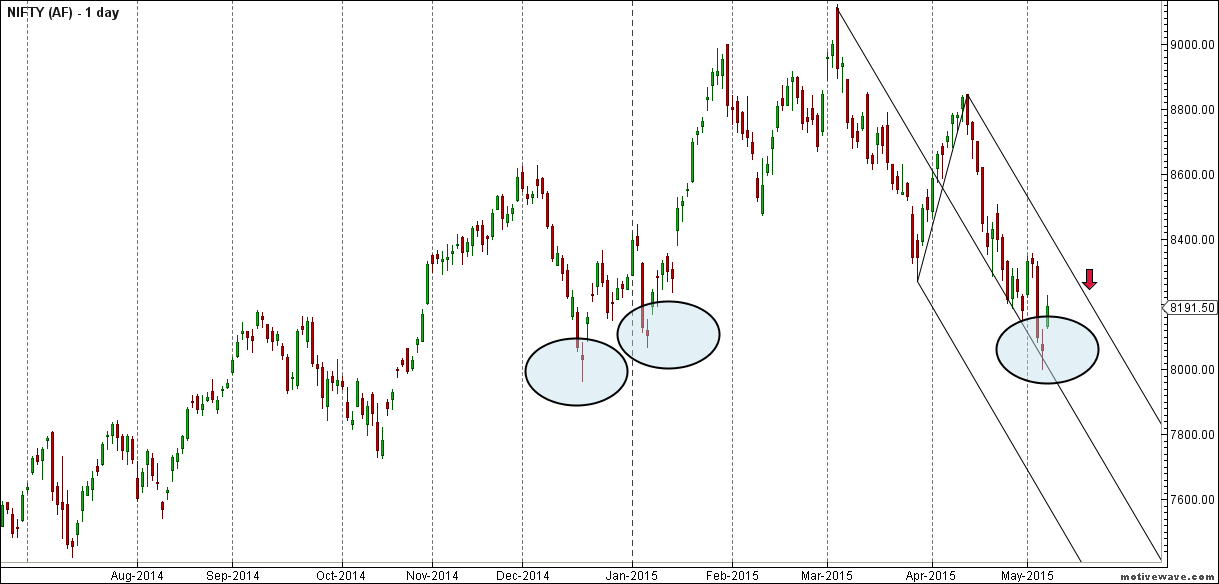
Supply and Demand Zone

Self Explanatory chart for Supply and Demand zone.
Nifty MML

Murry Math line support at 8125, break of same can see move towards 7972. 8281 is upper side target as per MML
Nifty Gann Date
Nifty As per time analysis 11 May/15 May is Gann Turn date , except a impulsive around this dates. Last week we gave 04 May/06 May Nifty saw a volatile move .
Nifty Gaps
For Nifty traders who follow gap trading there are 14 trade gaps in the range of 7000-9000
- 7067-7014
- 7130-7121
- 7276-7293
- 7229-7239
- 7454-7459
- 7526-7532
- 7598-7568
- 7625-7654
- 7780-7856
- 7927-7974
- 8257-8123
- 8937-8891
Fibonacci technique
Fibonacci fan

Approaching the 38.2% retracement zone.

8320 is 38.2% retracement number so keep a eye on this.
Nifty Weekly Chart
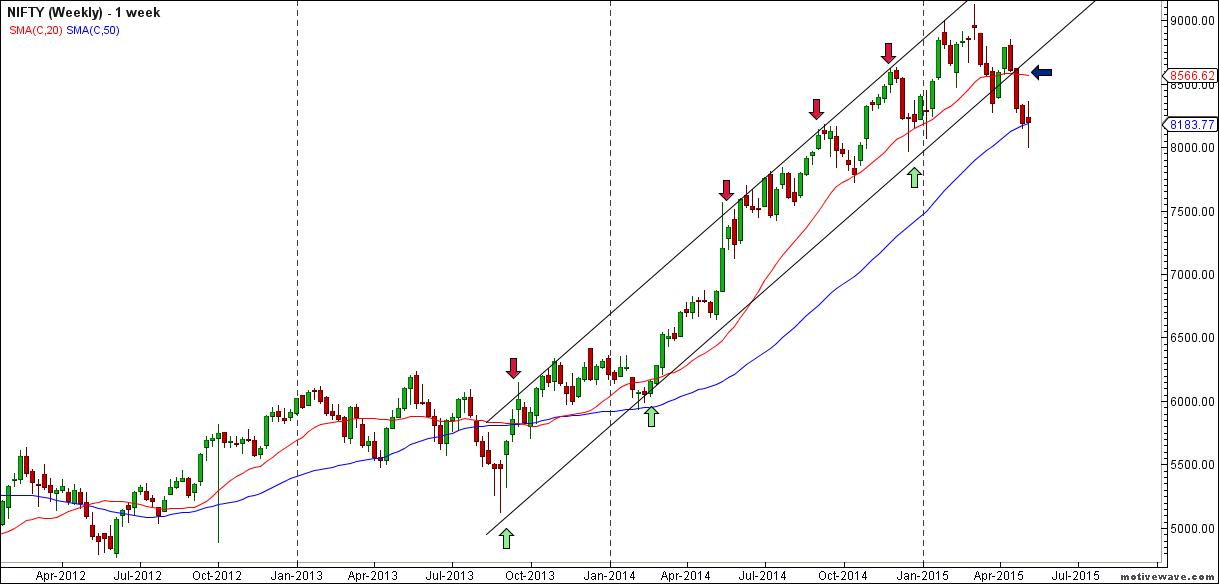
It was positive week, with the Nifty up by 10 points closing @8191 , and closing below its 20 WSMA and above its 50 SMA broken its its weekly channel Also taking support at its 50WSMA As discussed last week Entering new quadrant as per time analysis so exciting week ahead. Traders had a roller coaster rise last week, now we have entered new quadrant as per Time Analysis, also gunner will be entering new quadrant so bias is neutral to bullish for coming week with volatile moves.


Trading Monthly charts

Monthly chart took support near 23.6% retracement line. Higher time frames have turned in Sell on Rise mode so technical shift is happening from Buy on Dips to Sell on Rise.
Nifty PE

As per PE ratio has again up to 21.92, Result season is going bad unable to upgrade the earning can see nifty moving in bubble category.
Nifty Weekly Chopad Levels
Nifty Trend Deciding Level:8221
Nifty Resistance:8295,8355,8416
Nifty Support:8106,8007,7920
Levels mentioned are Nifty Spot
Let me go by Disclaimer these are my personal views and trade taken on these observation should be traded with strict Sl.Please also read the detailed Disclaimer mentioned in the Right side of Blog.
Want to see post in your Inbox,Register by adding your email id in Post in your Inbox section
Follow on Facebook during Market Hours: https://www.facebook.com/pages/Brameshs-Tech/140117182685863
Took short as per CHOPAD level below 8221 on 12-May and held the position for 8106(First target) but it didnt 🙁
Hourly charts has completed its ABC correction now 8247 and 200 SMA @8282 will play a vital role in coming week. Unable to close above 200 DMA, the second EW view can come into effect. IS IT WEEKLY CLOSING BASIS? IF NOT THEN NEW LOW EXPECTED 7600.
Its a medium term view.
Rgds,
Bramesh
NO leveraged positions this for cash market traders .
What does this mean bramesh ji?
The line is taken from Nifty Daily EW charts. (Blue colour)
Bcos of this u fear to renter in tradewhat to do
Need your help while trading some stock run during market open and slowly after opening like after an hour they loosse there growth like 18 points increase remain 4-5 points as a trader you will think better to book profit @12-13 points when u saw it loosing it increase then near end of market this stock will increase and go beyond t3 and in some cases they don’t increase but consolidate at same level how to trade in this situation
U do make us think .. Which is good sign .. 🙂
Sir, This week chopad levels and previous week chopad levels along with its resistances and supports are identical. This week also it holds the same level Sir. I will just follow your daily write ups about nifty. Just for curiosity to know I just raised this question. Pls donot mistake me. Regards.
anand
levels remain the same..