


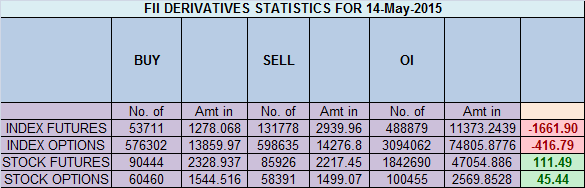
- FII’s sold 78 K contract of Index Future worth 1662 cores,19.7 K Long contract were squared off by FII’s and 58.3 K short contracts were added by FII’s. Net Open Interest increased by 38.6 K contract so today’s rise was used by FII’s to add shorts in Index Future. When to avoid trading
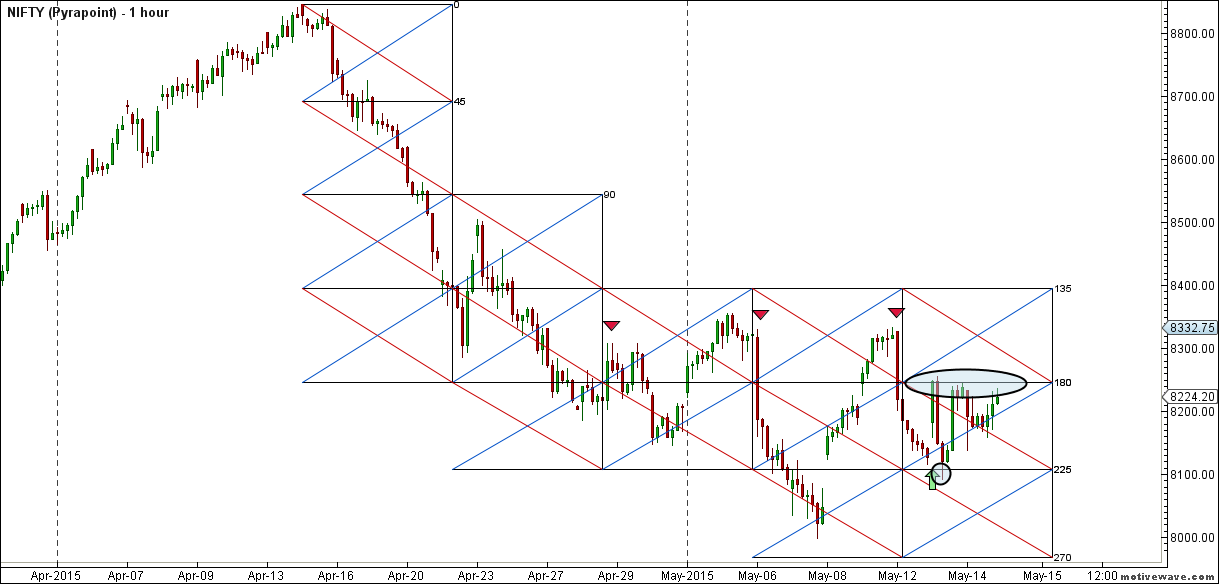
- Nifty from past 5 session has become very very volatile, In first 5 mins market was down 100 points recovered sharply and again closed near the highest point of day forming hammer pattern. Nifty formed inside day pattern on daily chart and also is forming triangle pattern in hourly pattern as shown in below chart,suggesting trending move in round the corner.Gunner is also entering new quadrant and pyrapoint supports are mentioned in below charts, Nifty is ready for an explosive move.


- Nifty May Future Open Interest Volume is at 1.40 core with addition of 2.1 lakhs with cost of carry going negative suggesting long position got closed. OI is lowest in last 3 months, such low OI generally suggests trending move is round the corner.
- Total Future & Option trading volume was at 2.16 core with total contract traded at 5.6 lakh. PCR @0.85 getting in oversold zone.
- 8500 CE OI at 53.2 lakh , wall of resistance @ 8500 .8100/8400 CE saw addition of 3.5 lakhs ,so bears added again in small quantity ,and still holding 93 lakh open position. FII sold 12.9 K CE longs and 16.5 K CE were shorted by them.Retailers have bought 1.07 lakh CE contracts in today’s session.
- 8000 PE OI@ 47.1 lakhs so strong base @ 8000. 8100/8400 PE liquidated 2.2 lakh so bulls ran for cover and holding just 18 lakh open position. FII bought 3.8 K PE longs and 3.2 K shorted PE were covered by them. Retailers have bought 26.3 K PE contracts in today’s session.
- FII’s sold 73 cores in Equity and DII’s bought 302 cores in cash segment.INR closed at 63.63
- Nifty Futures Trend Deciding level is 8202 (For Intraday Traders). NF Trend Changer Level (Positional Traders) 8230 and BNF Trend Deciding Level 18004 (For Intraday Traders) BNF Trend Changer Level (Positional Traders) 18080 How to trade Nifty Futures and Bank Nifty Futures as per Trend Changer Level .
Buy above 8236 Tgt 8260,8298 and 8333 (Nifty Spot Levels)
Sell below 8190 Tgt 8160,8130 and 8100 (Nifty Spot Levels)
Click Here to Like Facebook Page get Real time updates
I prefer the 8100, 8400 strangle to play the volatility game here. A big move is definitely on the cards.
what should be our approach if the market opens with gap up or up, i.e. already beyond the buy/sell level that you have given… should we wait & enter when it reaches the level mentioned again
No Level = No Trade
Sir can u throw some light on union bank of India levels
As per above chart its showing sideways triangle, whenever triangle forms index will move drastically/explosively eitherway and will break the diagonal resistance/support levels. One interesting thing is Fiis squared off their long positions and new shorts have been added it will suggest jouney towards 8000 or below unless we get some good news. Unfortunately don’t expect any good news except rate cut from rbi, parliament session has ended without land bill and get.
hello all readers. i contacted mr brahmesh ji about 1 month back for course fee inquiry he told me 14000 at that time i think for 4 days this is too high. after that i trade my own using brahmesh ji TC level for nifty positional . i trade in 100 qty booked half at 50 points. at this time i must say my course fee money i earn from market. now i will take proper course from him. i never saw such analysis where every post is as it is no manipulation or nothing hide. level to level trade with very disclipline . if u check this website u find post about months ago also . one more time thank you brahmesh ji for your valuable guidence to traders.
May I know the difference between SOLD & SHORTED
both are same
Fii datta is to negative so mkt react negativly aftr a gapup du to us mkt mkt will go down next day fii made a huge sort in index nd unbinding longs so in this srees 8355 can not cross
going down
Hi
Considering Indicators like parabolic SAR, RSI, Momentum on daily & weekly charts – market has reached OS zone only & ready for upswing.
I have no position on either side. So am enjoying market moves & presently looking for investment opportunities.
Any idea on KVB for short term? In my charts its a buy.
Bramesh bhaai – Ur technical view is mostly appreciable.
Thanks !!
i dont have enough knowledge for technical analysis or chart analysis or so..but a simple observation n my experience till date suggest me that 8000-8500 is niftt’s range for may series..n to be very specific 8000-8350 range..
n i guess all this 7400 n 9000 kind of targets are just illogical as of niw unless n until some very imp girl news / change comes out suddenly..
technically if fii s are on shorting side, they will just take a single day n 100 nifty to square off their positions n turn around..
so better stick to 8000-8350 or 8500 on upper side..simple…
perfect analysis !!
Sir, my analysis says Nifty will crash very badly by the end of the series .. it will start tomorrow .. will open gap up and then drift lower and lower all day .. around 7400 it will give very good buying opportunity…
Will you be kind enough to post the basis of your analysis and this inference. Thanks
God only knows up or down. Just accept the market as it is. Market is ultimate.
Ramesh Bhai from here will nifty goes up or down ? Not able predict market. Can you plz just on it.
Bramesh Ji, when you say Nifty is ready for an explosive, does it mean Upside or Downside??? Coz as per FII data and analysis you shared its clearly downside? Please clarify this point. Thank You!
Please use TC level, trading above it move is expected to be on upside.
RGds,
Bramesh
as per your above chart nifty may go big up move. 2morrow is gaan day. big up move possible