


Last week we gave Nifty Chopad level of 8114 and Nifty did 3 target on downside and almost did 1 target on upside. Lets analyze how to trade in September Expiry Week.
Nifty Hourly Chart
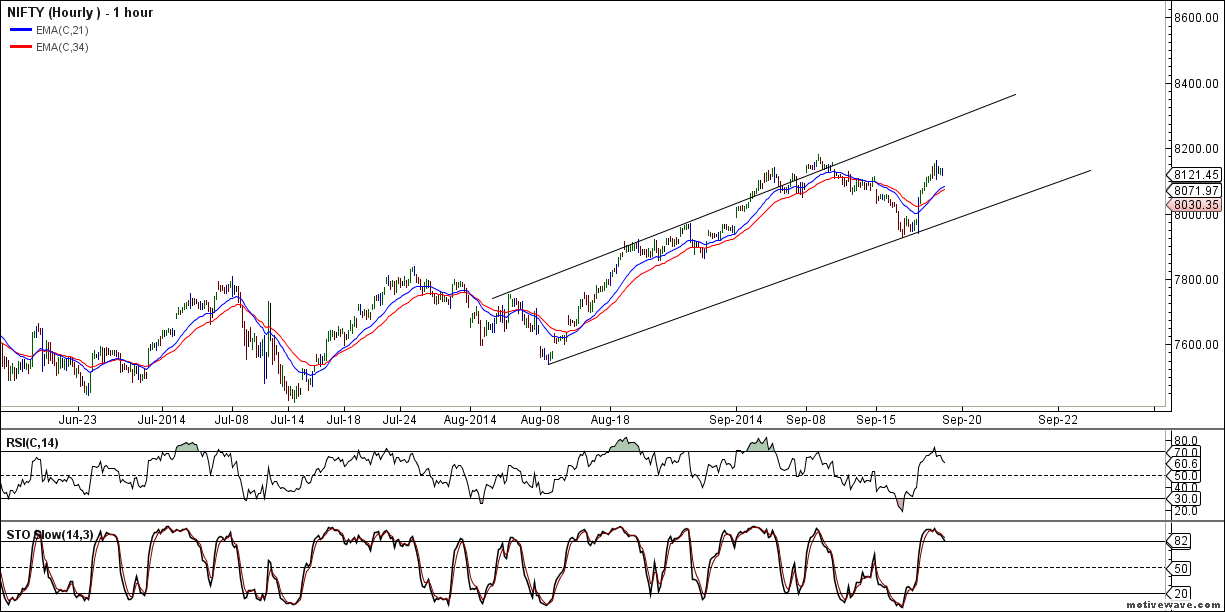
Nifty Hourly charts made a V shaped recovery from channel bottom now facing resistance in zone of 8130-8150, Closing above it only can see an upmove till 8250 odd levels.
Nifty Hourly Elliot Wave Chart

Hourly EW is showing if 8160 is not crossed correction tilll 8015.
Nifty Price Channel
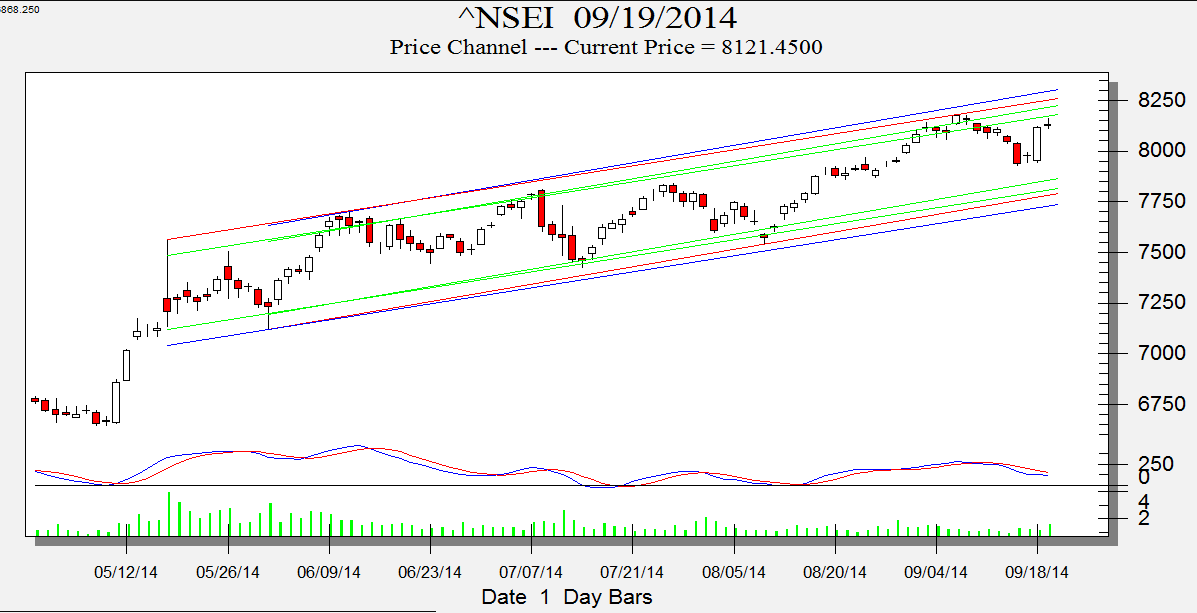
As per Price Channel concept Nifty is entering in zone of supply as seen in above chart unable to cross it can see downmove to lower end of channel around 7950-8000.
Nifty Daily Chart
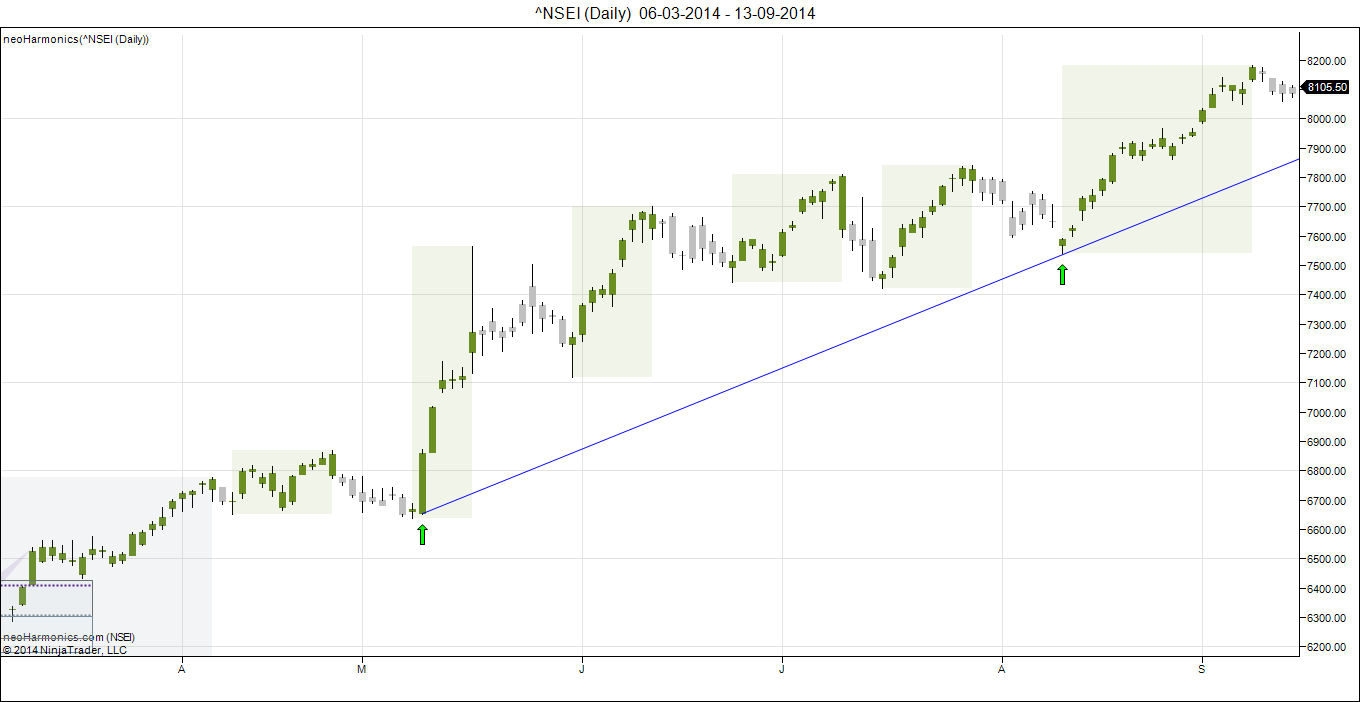
Nifty daily chart bias has turned from bullish to neutral so expect some range bound move in nifty in coming week.
Nifty Daily Elliot Wave Chart
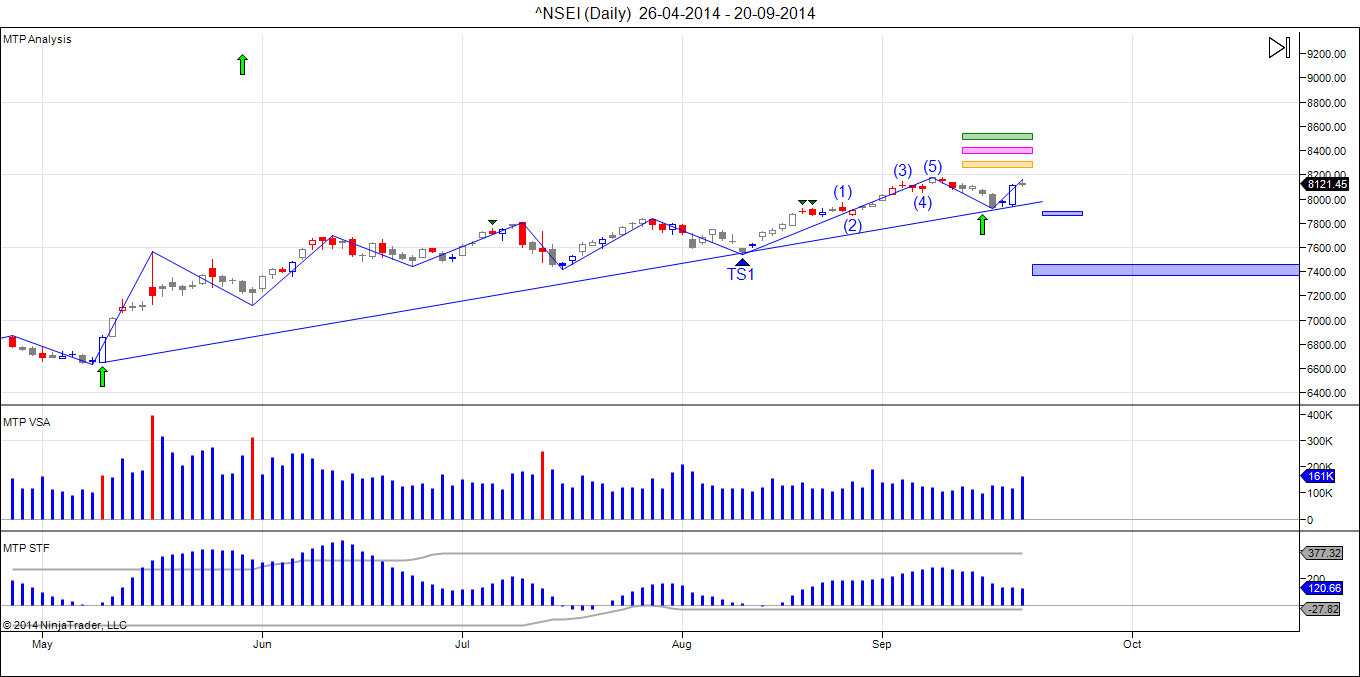
Daily chart are is showing 3 wave completion around 8180 and pullback can be seen as part of 4 wave till 8000/7921 in coming week before next round of upmove.
Nifty Gann Date
As per time analysis 22 Sep is Gann Turn date, except a impulsive around this date. Last week 16 Sep gave the big move as expected.
Nifty Gaps
For Nifty traders who follow gap trading there are 7 trade gaps in the range of 7000-7800
- 7067-7014
- 7130-7121
- 7276-7293
- 7229-7239
- 7454-7459
- 7526-7532
- 7598-7568
- 7625-7654
- 7874-7881
- 7904-7916
Fibonacci technique
Fibonacci fan
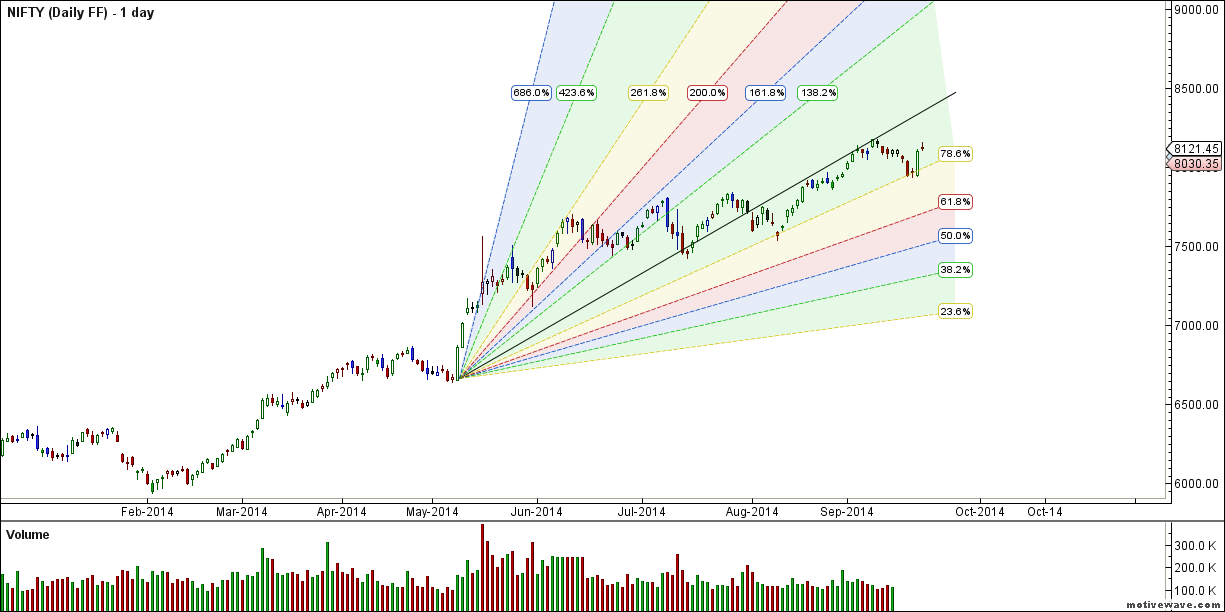
7950-7984 needs to be closely watched as per gann fan.
Nifty Fibonacci Retracement
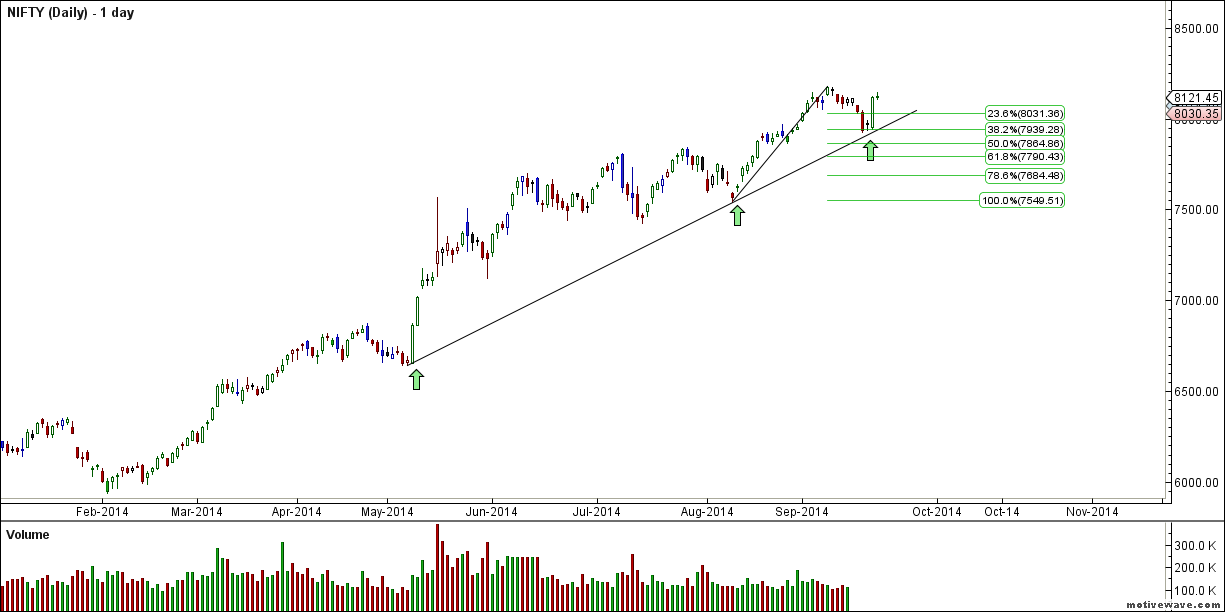
7939/7864 are 2 Fibo retracement levels which needs to be watched closely.
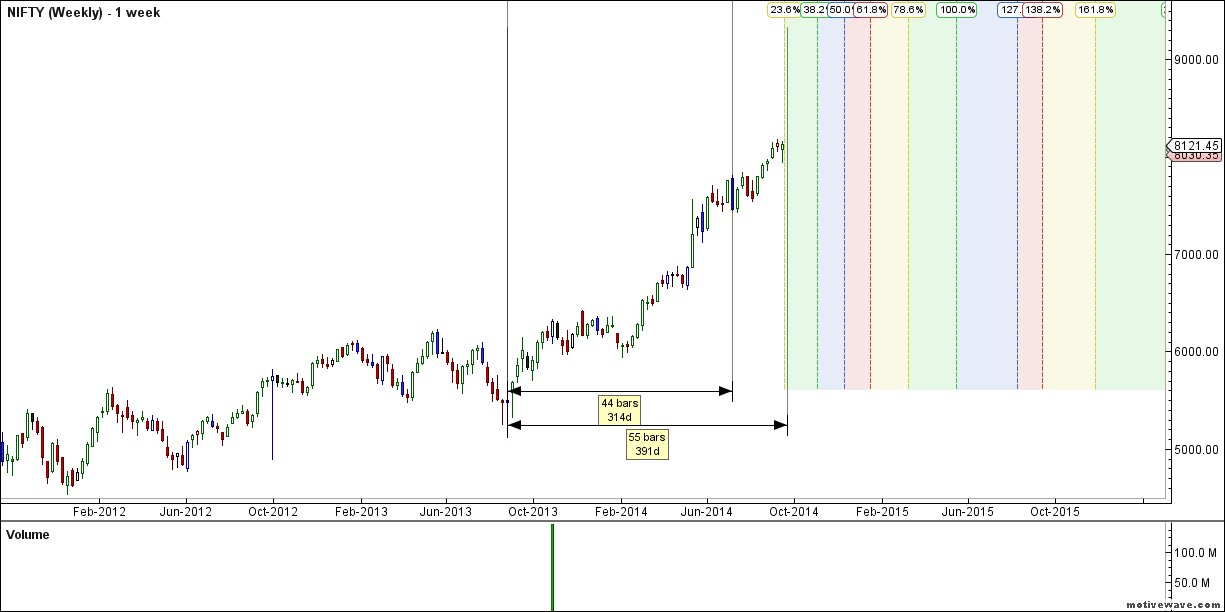
Nifty Weekly Chart

It was positive week, with the Nifty up by 15 points closing @8121 forming a Hammer candle pattern. As per Harmonic Bias as seen in above chart, first time after 6000 and 31 week we are seeing trend change from Bullish to Neutral, so expect choppy/sideways move till the Harmonic Bias turn back to Bullish zone.Nifty took exact support near Andrew Pitchfork support line and now need to see will be see a pullback or next round of upmove. Negative divergence have started coming on weekly charts, break of 7950 can see the divergence come in effect.Also we are approaching the 55 day cycle on Weekly charts also.Weekly time analysis suggests next cycle which is mostly to be sideways/negative to start soon.
Trading Monthly charts
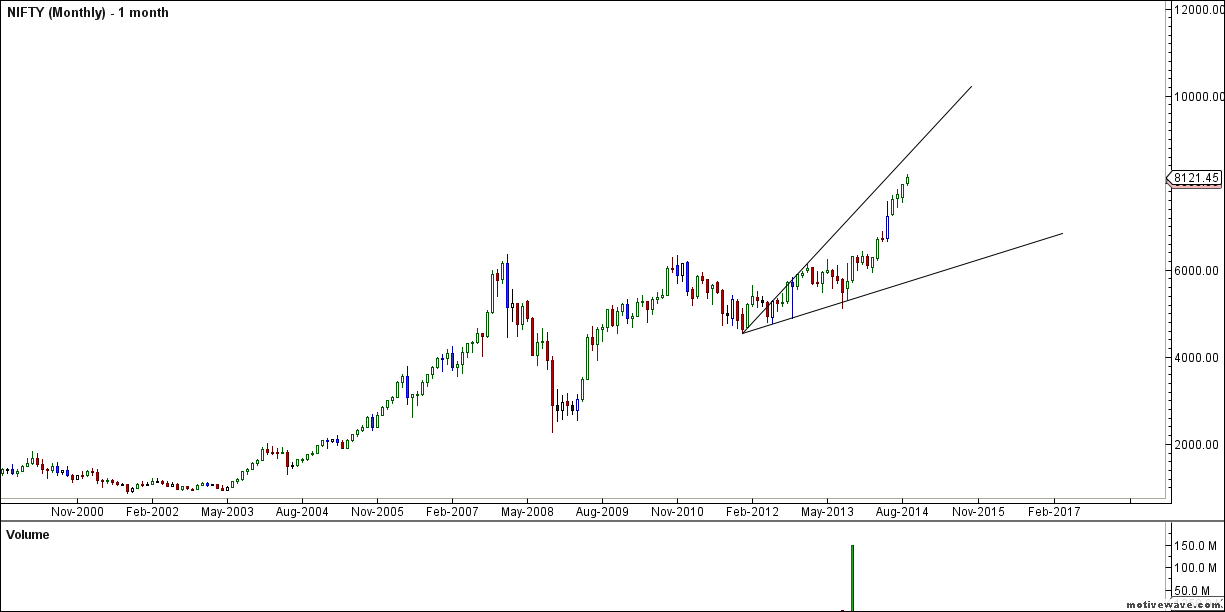
Bulls will have to save 7950 for momentum to build in September Month.
Nifty Weekly Chopad Levels
Nifty Trend Deciding Level:8100
Nifty Resistance:8160,8213, 8286
Nifty Support:8026,7977,7921
Levels mentioned are Nifty Spot
Let me go by Disclaimer these are my personal views and trade taken on these observation should be traded with strict Sl
Want to see post in your Inbox,Register by adding your email id in Post in your Inbox section
Follow on Facebook during Market Hours: https://www.facebook.com/pages/Brameshs-Tech/140117182685863
Thanks all Its corrected
I thik support & resistance leval is written vice versa
Sir is it correct?
Nifty Resistance:8026,7977,7921
Nifty Support:8160,8213, 8286