


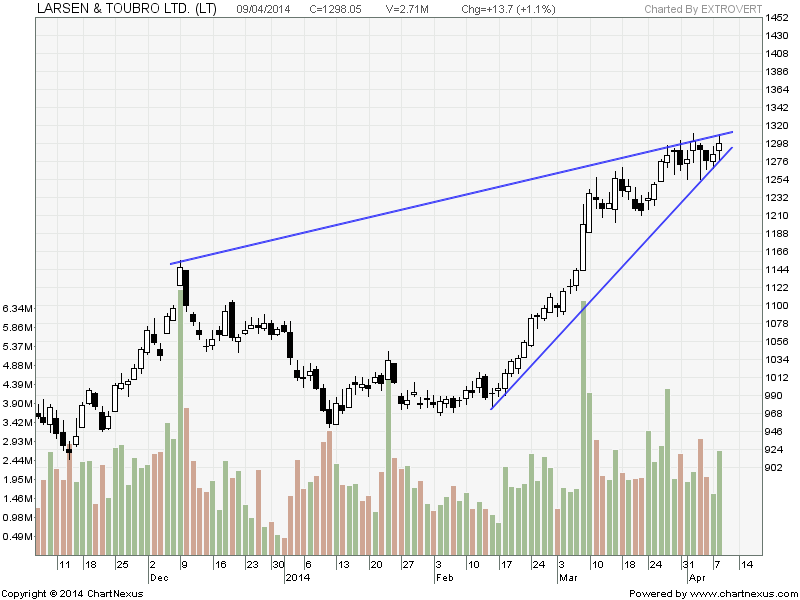
Larsen
Buy above 1300 Tgt 1312,1326 and 1340 SL 1295
Sell below 1292 Tgt 1281,1264 and 1250 SL 1298
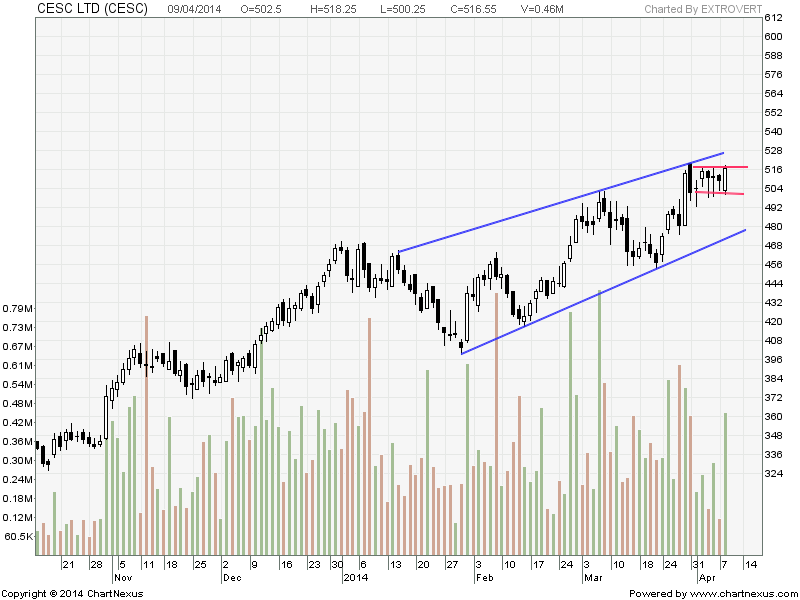
CESC
Buy above 518 Tgt 523,529 and 535 SL 516.5
Sell below 511 Tgt 505,500 and 495 SL 513
Syndicate Bank
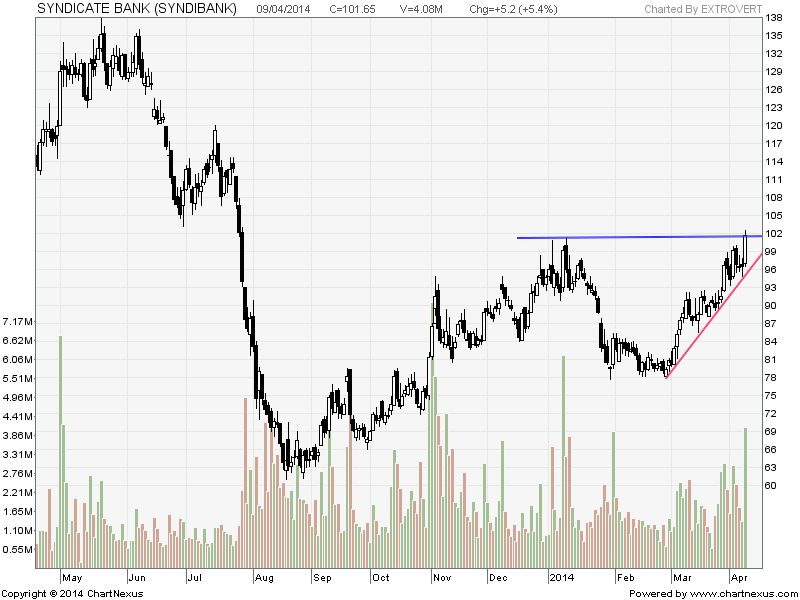
Any close above 103 stock is heading towards 111
Buy above 102.5 Tgt 103.9,106 and 109 SL 101.5
Sell below 100 Tgt 98,96 and 94 SL 101.5
Performance sheet for Intraday and Positional is updated for April
http://tradingsystemperformance.blogspot.in/
http://positionalcallsperformance.blogspot.in/
- All prices relate to the NSE Spot
- Calls are based on the previous trading day’s price activity.
- The call is valid for the next trading session only unless otherwise mentioned.
- Stop-loss levels are given so that there is a level below/above, which the market will tell us that the call has gone wrong. Stop-loss is an essential risk control mechanism; it should always be there.
- Book, at least, part profits when the prices reach their targets; if you continue to hold on to positions then use trailing stops to lock in your profits.
thanks sir
sir, please tell. in your positional call of stock. when you entered in trade. when price breach that level or the price closed above that level and next day you purchase. same for how you follow SL. it is closing basis or level touch basis.
IF price goes above and sustain for 1 hour positional trades can be taken and SL remains any close below the trigger level.
Rgds,
Bramesh
Hi Sir ,
I’m following your calls daily . what is correct time to enter for gap-up opened calls .
Regards,
Ravi