


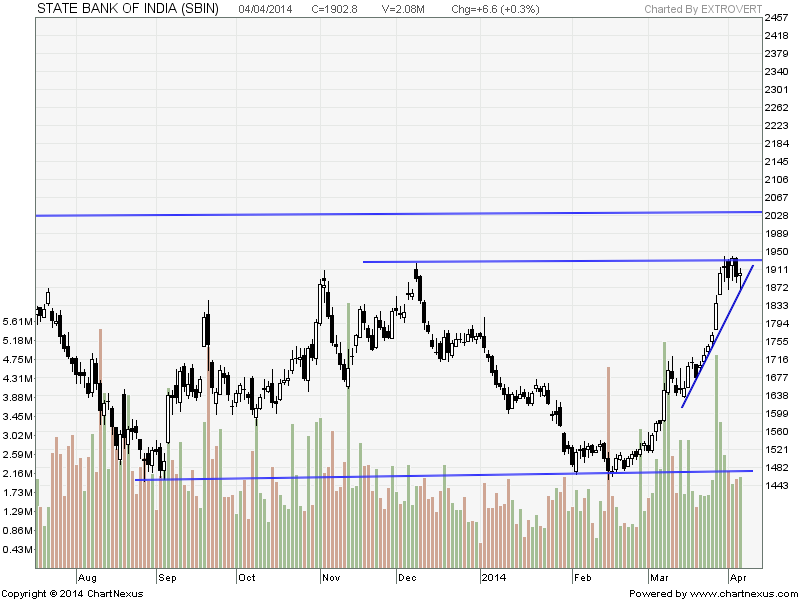
SBIN
Buy above 1905 Tgt 1920,1937 and 1960 SL 1894
Sell below 1892 Tgt 1877,1855 and 1835 SK 1902
HDFC
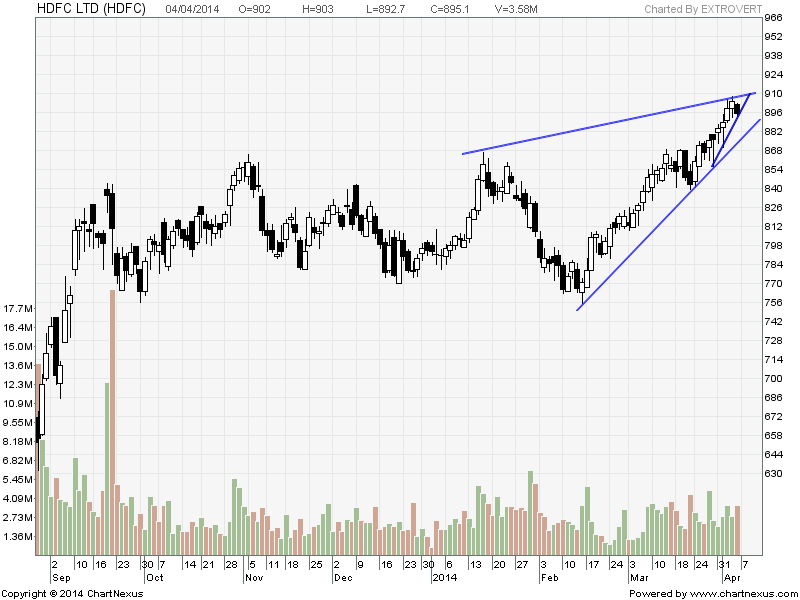 Positional traders should look for close above 898 for short term target of 930, Any close below 890 stock is heading towards 843.
Buy above 897 Tgt 901,907 and 911 SL 895
Sell below 890 Tgt 886,880 and 837 SL 892
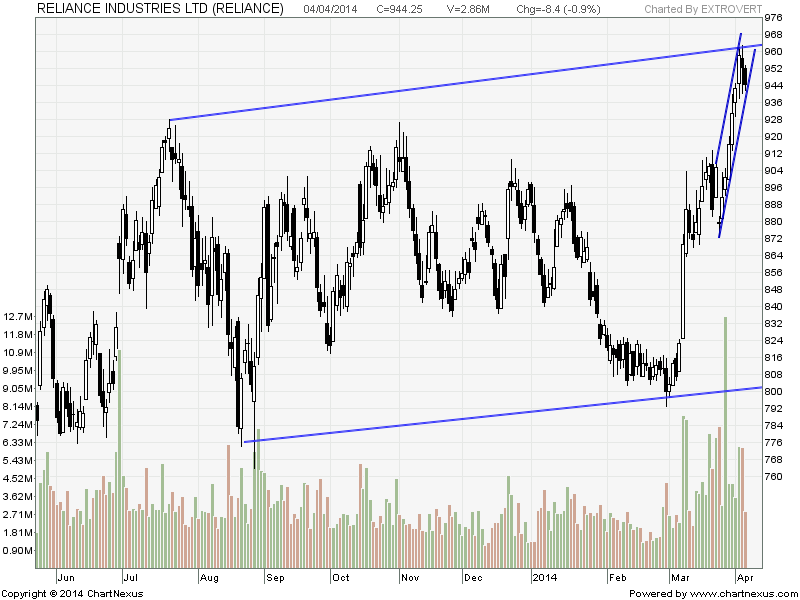
RIL
Buy above 947 Tgt 951.2,957 and 962 SL 944
Sell below 939 Tgt 934,928 and 922 SL 942
Performance sheet for Intraday and Positional is updated for February, Intraday Profit was 1.04 Lakh and Positional Profit was 0.99 Lakh
http://tradingsystemperformance.blogspot.in/
http://positionalcallsperformance.blogspot.in/
- All prices relate to the NSE Spot
- Calls are based on the previous trading day’s price activity.
- The call is valid for the next trading session only unless otherwise mentioned.
- Stop-loss levels are given so that there is a level below/above, which the market will tell us that the call has gone wrong. Stop-loss is an essential risk control mechanism; it should always be there.
- Book, at least, part profits when the prices reach their targets; if you continue to hold on to positions then use trailing stops to lock in your profits.
In the recommendations on positional trading — like HDFC today — only entry points and targets are given. It would be really helpful if StopLoss is also included. Tks.
HDFC did not close above 898 so no positional trade triggered, SL is trigger level on closing basis
Rgds,
Bramesh