


Last Week Chopad Level of 6102 did not got triggered as Nifty opened gap down, Bulls were able to protect the 200 DMA on weekly basis and also closing Nifty above 6000. Next week will be very busy, and the scheduled events should contribute to the already growing market volatility.
Nifty Hourly Chart

Nifty Hourly charts has taken support above its 50 DSMA, and sustaining below it, bulls will have upper hand. 6189-6200 is the range which will decide the further trend of market.
Nifty Daily Chart
Nifty is still trading in the range of 5900-6355. Nifty has formed both Double top and Double bottom formation in this range.Immediate trend is still negative but if nifty held on to 6030 bounceback can continue till 6140-6200 which will further decide the trend of market. On crowd theory basis, most of traders are bearish on market and looking for Selling on every rise. Do remember market always move in direction which gives pain to 90% of traders.
Nifty Gaps
For Nifty traders who follow gap trading there are 9 trade gaps in the range of 5300-6400
- 5285-5303
- 5448-5553
- 5680-5700
- 5780-5802
- 6141-6145
- 6331-6345
- 6266-6183
- 6120-6089
Fibonacci technique
Fibonacci fan

Nifty Fibonacci fan are wonderful tool to find the top and bottom in short term.Nifty is still trading below the fibo fan angle, Pullback can be seen to Fibo fan resistance of 6200

As per Fibo retracement ,6144-6192 are the fibo retracement, which needs to closely watched in coming week.
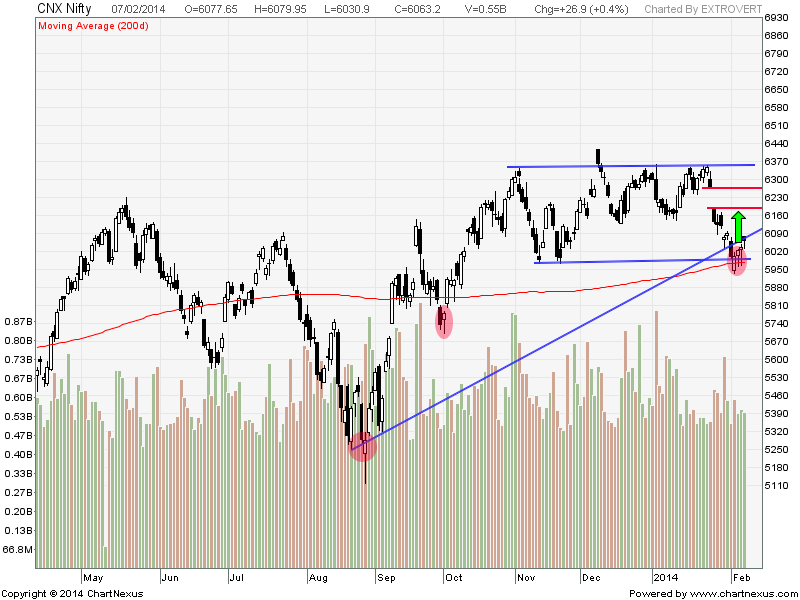
Nifty Weekly Chart

It was bearish week, with the Nifty down by 26 and losing 0.4% closing @6063. Nifty held on to its weekly trendline on weekly closing basis also forming a hammer pattern on weekly charts.
Trading Monthly charts
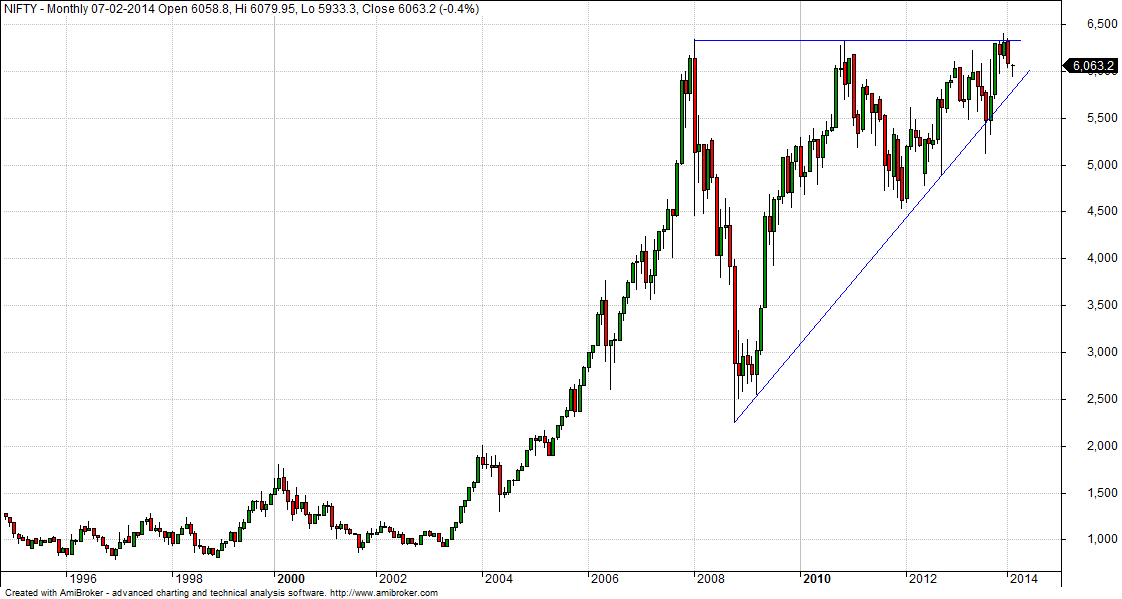
Triple top on Monthly chart which is bearish pattern till 6360 is not crossed on Monthly basis.
Nifty Trading Levels
Nifty Trend Deciding Level:6102
Nifty Resistance:6175,6220 and 6266
Nifty Support:6030,5970 and 5900
Levels mentioned are Nifty Spot
Let me go by Disclaimer these are my personal views and trade taken on these observation should be traded with strict Sl
Want to see post in your Inbox,Register by adding your email id in Post in your Inbox section
Follow on Facebook during Market Hours: https://www.facebook.com/pages/Brameshs-Tech/140117182685863