


USD INR Hourly
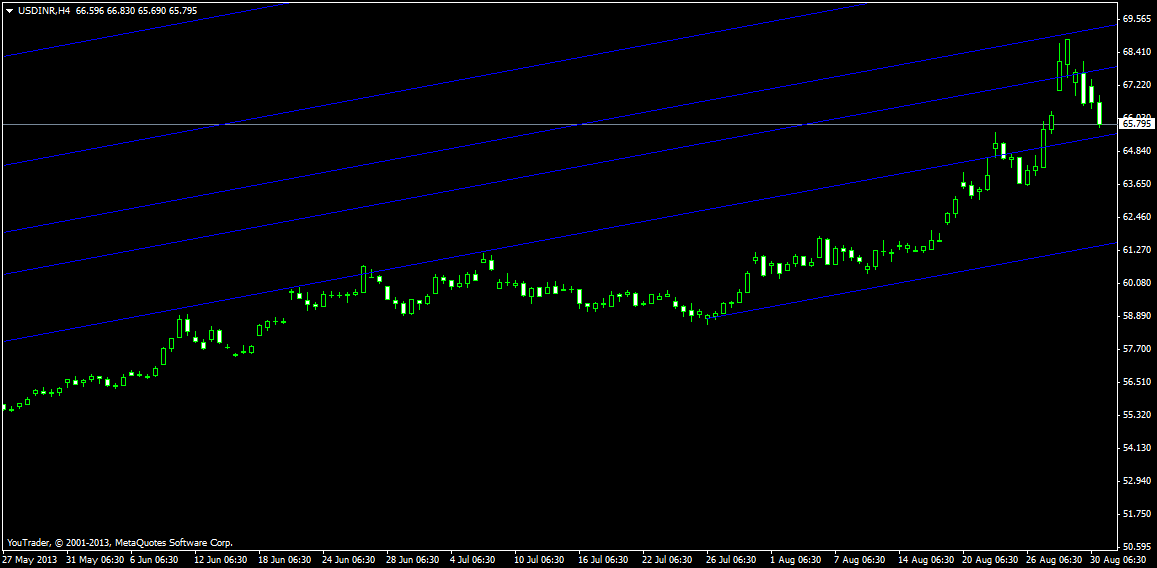 USD INR Hourly charts have pulled back from Fibo Channel and heading towards the support of 65. Holding the same bounce back can be expected. towards recent high again where it might form a double top and start its bearish journey.
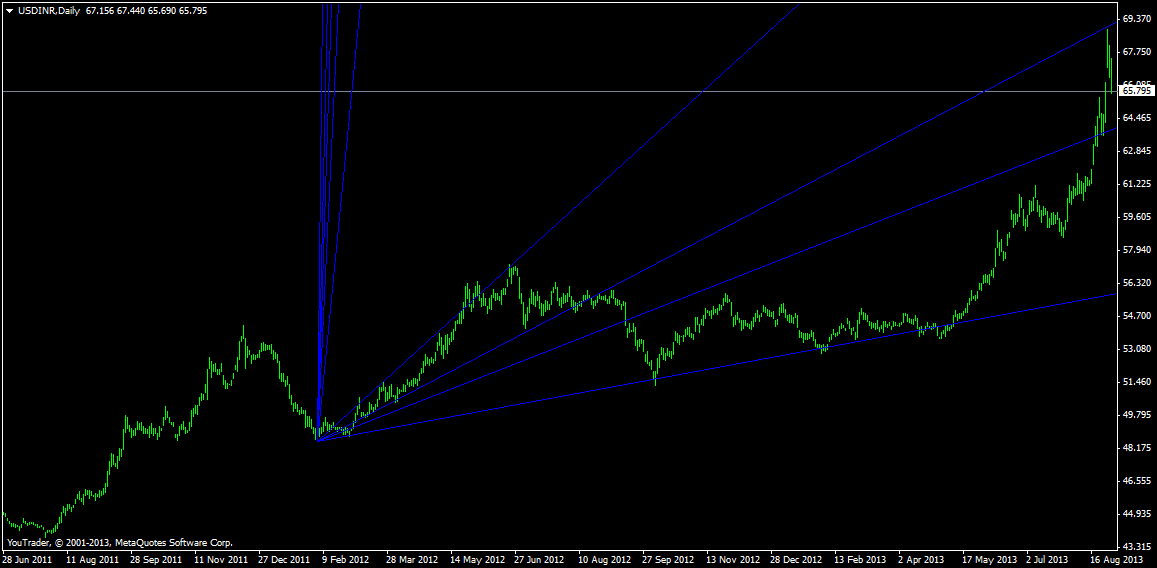
USD INR Daily

USD INR chart As par Gann Fann INR is a top of fan suggesting short term correction on cards.It has made top on Gann fan and has started its downward journey .Support exits at 64 at next gann fan level.
USD INR Weekly
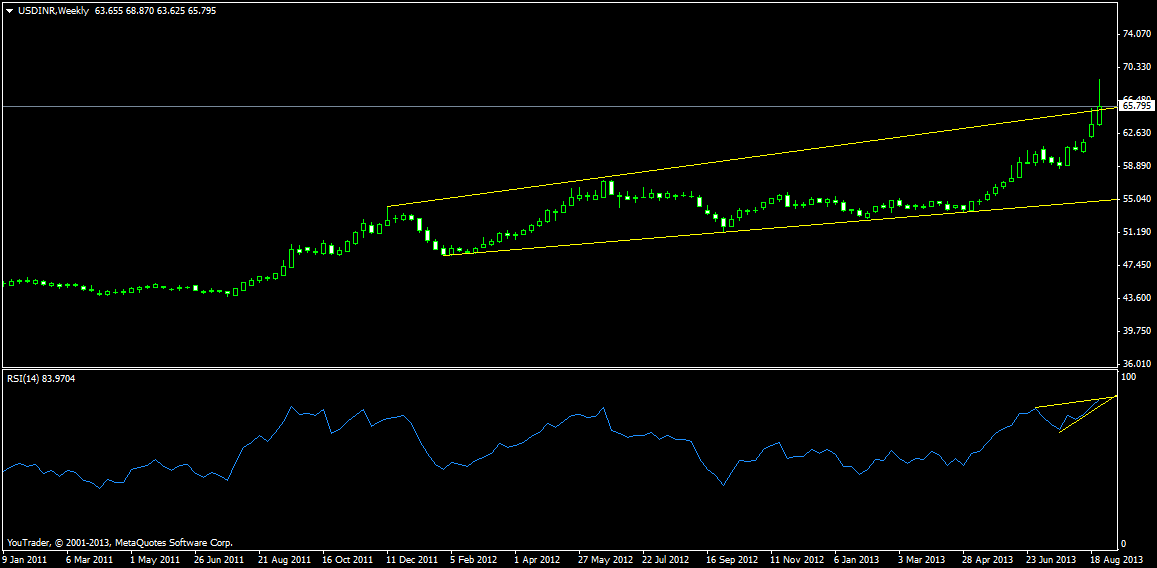
Weekly charts tried moving above the weekly trendline but failed to do so. Suggesting short term bearishness in INR.
USD – INR Trend Deciding Level:67
USD – INR Resistance:67.55,68.7 and 69.5
USD – INR Support:66,65.3and 64.4
Levels mentioned are USD – INR August Future
Follow on Facebook during Market Hours: http://www.facebook.com/pages/Brameshs-Tech/140117182685863