


SBIN
 SBI has been falling like pins after making high of 2472 and is now approaching its medium term trendline support. SBI can give a whipsaw by trading below the trendline traders do remember range of 1974-1980 is very important support as per Gann and Fibo Spiral number and positional shorts can be booked in this range. Positive divergence is also seen in daily charts.
Buy above 2020 Tgt 2035,2047 and 2065 SL 2012
Sell below 1994 Tgt 1975,1947 and 1930 SL 2001
IDFC
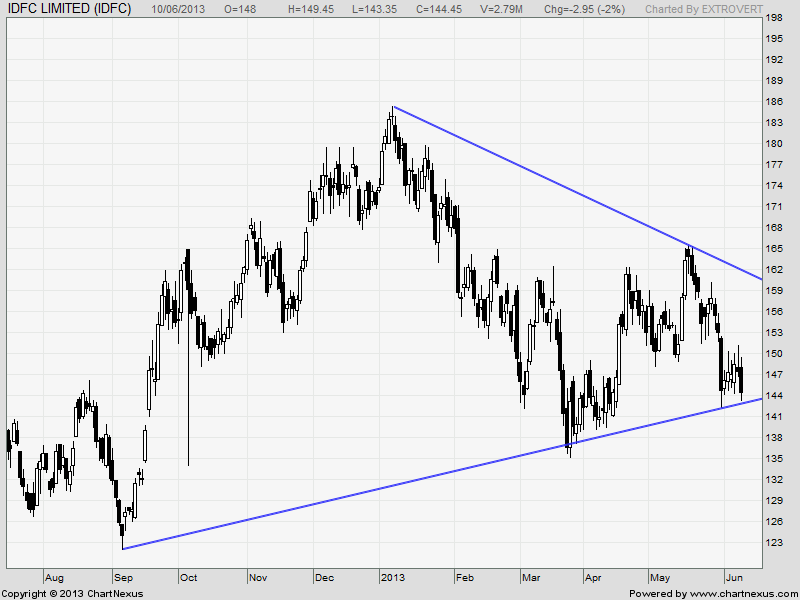
IDFC is also approaching is medium term trendline,holding 143 bounce back can be expected.
Buy above 146 Tgt 148,151 and 153 SL 144.5
Sell below 143 Tgt 141,139 and 136 SL 144.5
Reliance Infra

Rel Infra High Beta Stock is stuck is trendline crossover range, which is very unique pattern and gives good trading moves for quick gains.
Buy above 377 Tgt 381,385 and 389 SL 372
Sell below 367 Tgt 364,359 and 355 SL 371
Stock Performance Sheet for the Month of June is Updated @http://tradingsystemperformance.blogspot.in/ Net Profit for the month of May is 39325/-
- All prices relate to the NSE Spot
- Calls are based on the previous trading day’s price activity.
- The call is valid for the next trading session only unless otherwise mentioned.
- Stop-loss levels are given so that there is a level below/above, which the market will tell us that the call has gone wrong. Stop-loss is an essential risk control mechanism; it should always be there.
- Book, at least, part profits when the prices reach their targets; if you continue to hold on to positions then use trailing stops to lock in your profits.
We do discussion in Live market to update Nifty levels If you are interested you can LIKE the page to get Real Time Updates.
Follow on Facebook during Market Hours: http://www.facebook.com/pages/Brameshs-Tech/140117182685863