


Next week will be crucial for both Indian and Wold market as the two central bankers – Duvvuri Subbarao and Ben Bernanke will be solving the puzzle markets have been contemplating from past 1 month . The RBI Governor on Monday will let us know if we are getting the rate cut and US Fed will be giving more clarity on withdrawing the QE from the market as more signs of improving US economy emerges. Volatility will be name of the game so trader with a trading plan and stick to your stop losses.
Last week we gave Trend Deciding level as 5921 Nifty achieved 3weekly targets on downside.
Nifty Hourly Chart

Nifty Hourly charts is taking resistance at 50 HSMA, looking at hourly chart closely nifty in current down move 50 HSMA has played a crucial role. So any further up move above 50 HMSA only.
Nifty Gaps
For Nifty traders who follow gap trading there are 1 trade gaps in the range of 5400-6000 and all other gaps got filled.
- 5878-5868
- 5699-5739
Nifty Daily Chart
On Daily chart closed below 200 DMA for 3 days, but weekly close was well above 200 DMA@5800. Holding above 200 DMA gives bulls a sigh of relief . Tomorrow we have RBI Policy and good policy signal will continue with further pullback.

Fibonacci technique
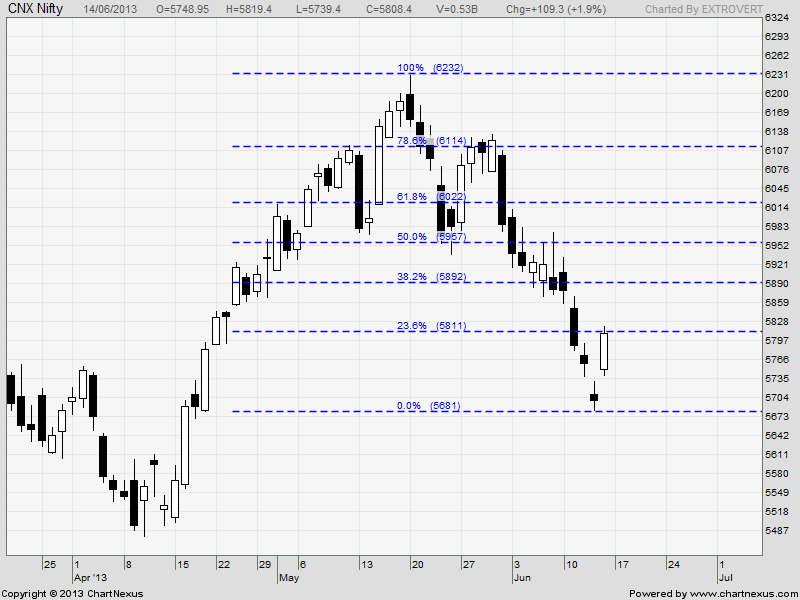
As per of Fibo Retracement theory Nifty took resistance at 5811 which is 23.6 % retracement from 5683-6229. Above 5811 next target comes at 5881.
Fibonacci fan

Nifty Fibonacci fan are wonderful tool to find the top and bottom in short term.Nifty closed below the Fibo Fans gave the follow up down move took exact support at Fibo Fans and gave a bounce back.
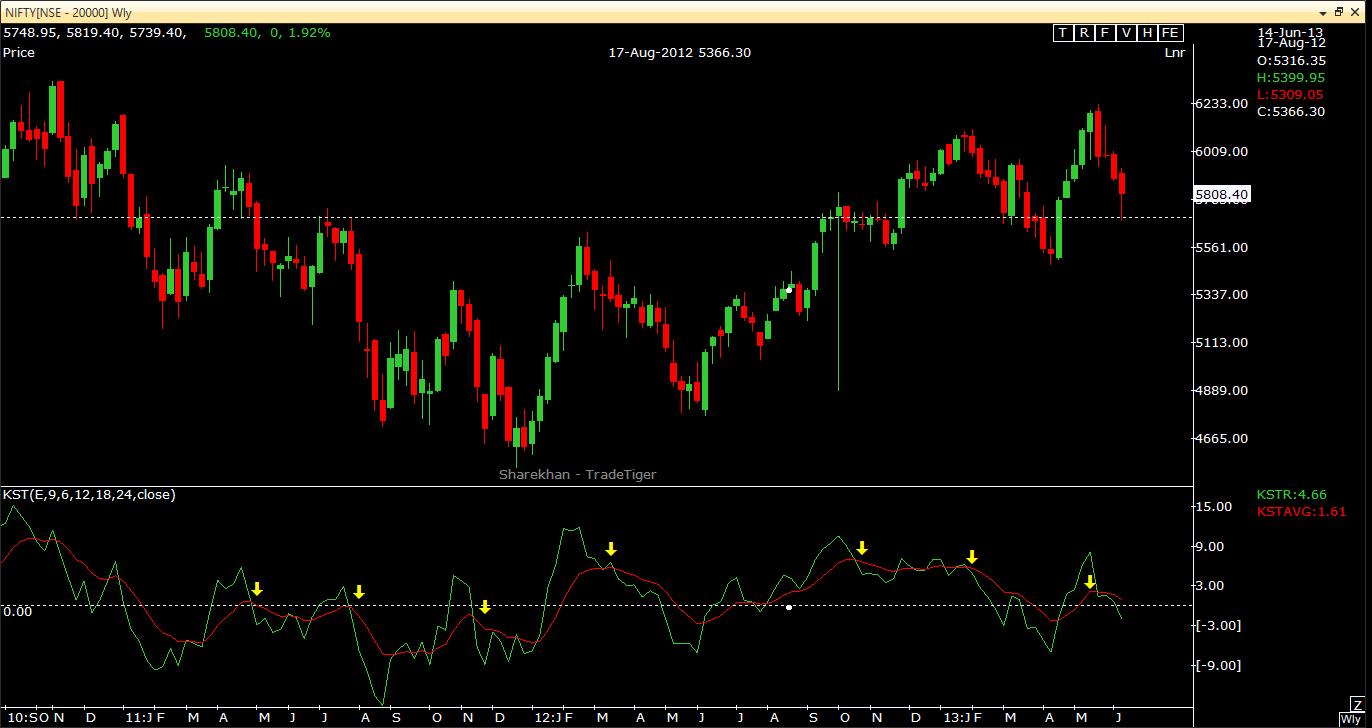
Nifty Weekly Chart

Trading Monthly charts

Monthly charts have given a failed breakout, Nifty has also formed a topping tails formation on the monthly charts. Topping tails are essentially bearish signals.
Nifty Trading Levels
Nifty Trend Deciding Level:5830
Nifty Resistance:5880,5931 and 5961
Nifty Support:5739,5685 and 5630
Levels mentioned are Nifty Spot
Let me go by Disclaimer these are my personal views and trade taken on these observation should be traded with strict Sl
Want to see post in your Inbox,Register by adding your email id in Post in your Inbox section
Follow on Facebook during Market Hours: https://www.facebook.com/pages/Brameshs-Tech/140117182685863
Hourly Chart pattern showing ‘Bullish island reversal’, also it is evident in daily charts.
Hi Hari,
Island Reversal needs a follow up price action to confirm the pattern.
Rgds,
Bramesh
Above 5811 target is……………
5880
One technical indicator is telling bullish view And another bearish!so what is the final view to take?
Well thats why we trade on Price action trading startegy which removes the confusion in mind. Weekly trading levels will help you out..
Rgds,