


Last Week we discussed Trading using Stochastic This week we will focus on learning new Indicator Force Index.
Introduction
The Force Index is developed by Trading for a Living fame author Alexander Elder , is an oscillator that measures the force of bulls behind particular market rallies and of bears behind every market correction.According to Elder, there are three essential elements to a Financial Instrument price movement: direction of market move ie Up or down, extent of the move and volume.Force index is one of the best indicators for combining both price and volume.
The three key components of the force index are:
- Direction of Price Change
- Extent of Price Change
- Trading Volumes
The Force Index combines all three as an oscillator that fluctuates in positive and negative territory as the balance of power shifts. The Force Index can be used to reinforce the overall trend, identify corrections and reversals in Financial Markets.
Calculation
The force index is calculated by subtracting yesterday’s close from today’s close and multiplying the result by today’s volume.
- If closing prices are higher today than yesterday, will result in a positive force index above centerline.
- If closing prices are lower than yesterday’s, will result in a negative force index below centerline.
- If closing prices do not change, unchanged market will return a force index directly on the zero line
Force Index(1) = {Today’s Close – Yesterday’s Close )} x Volume
Force Index(13) = 13-period EMA of Force Index(1)
Force Index 1 data will be full of noises and data will not be in readable format, Therefore Traders generally uses 13 Period EMA for a smoother and readable data.Volume plays a critical role in Force Index as shown in above formula. A big move on big volume produces a high Force Index values confirming the validity of move. Small moves on low volume produce relatively low Force Index values singalling whipsaw can happen.
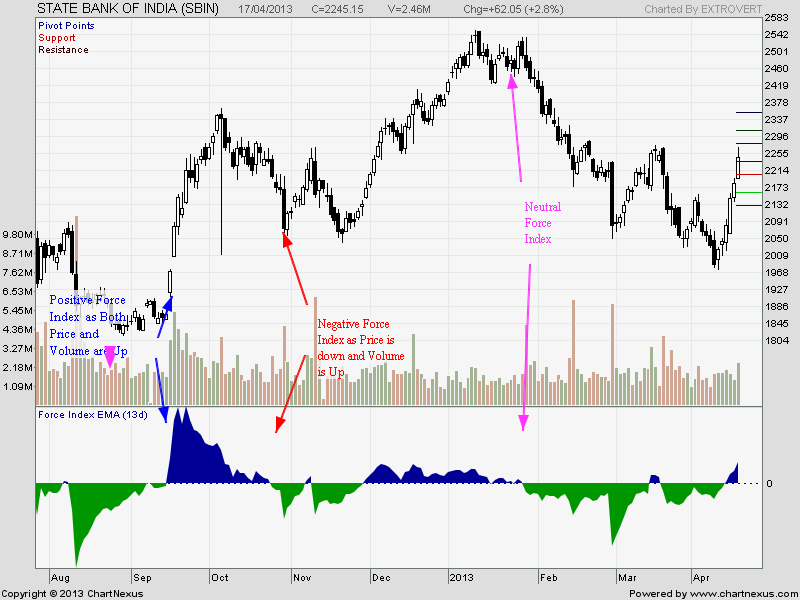
As seen in above Daily Chart of SBI Positive, Negative and Neutral Force Index are shown. Click on Chart to Enlarge
How to Interpret Force Index
When force index hits a new high,Bulls are in control of market and uptrend will continue further.
When force index hits a new low, the bears have greater strength and the downtrend will usually sustain itself.
A flattening force index means that the observed change in prices is not supported by either rising or declining volume and that the trend is about to reverse ie. a flattening force index could indicate a trend reversal, if a high volume corresponds with only a small move in prices.
So in this article we have discussed the Introduction and Interpration of Force Index, In Next Article will discuss How to Trade based on Force Index.
Follow on Facebook during Market Hours: http://www.facebook.com/pages/Brameshs-Tech/140117182685863
Great value addition to our knowledge in the most simple language as usual. .Thanks & Warm Regards. CA PRAKASH TANAK