


As discussed on 5 Apr Gold technical analysis before crucial Jobs data Gold bounced from 1540 odd levels and achieved all target on upside. After rally on Friday gold went into consolidation phase in past 2 days. Lets analyse whats in store for today.
Gold Hourly Chart
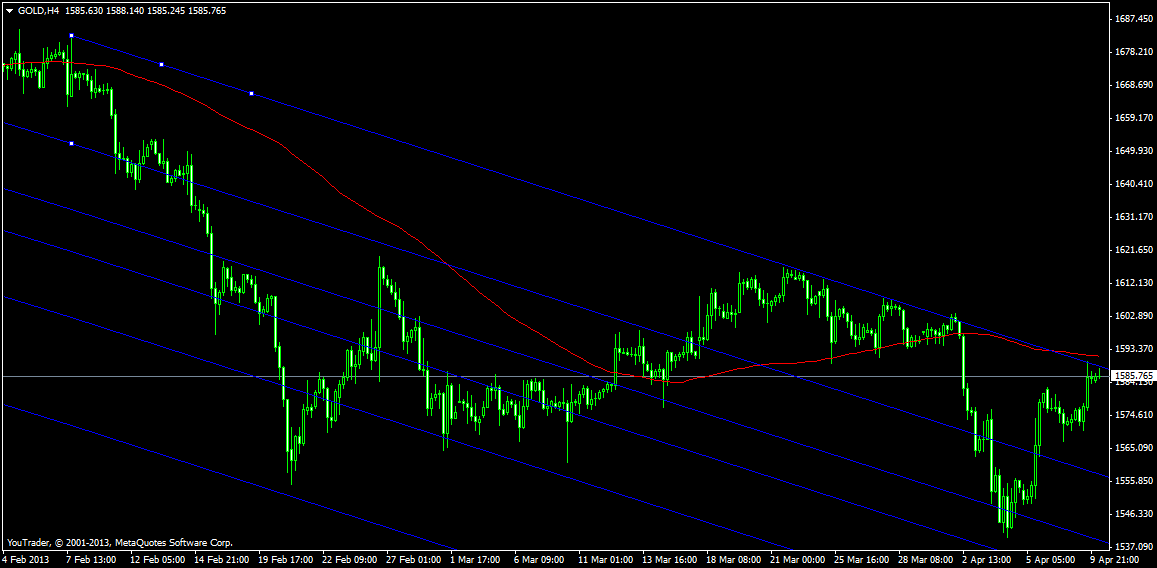
Gold 4 Hour chart with Fibo regression channels,is shown Gold is trading near the upper resistance zone 1588-1590$. Unable to break the 1590$ pullback till 1560-62 should be expected.
Gold Daily

As per daily charts gold has taken support at zig zag lines of 1539 and bounced back,Positive divergence showed its effect with bounceback till 1590. Gold is near its 20 DMA@1592 so range of 1590-1592 becomes a crucial range.
As per Weekly charts gold is nearing very important 2 year support of 1526 which has resulted in swift pullback last 3-4 times.Traders holding shorts can book out 60% of short near 1526 levels which should eventually come by today or tomorrow. Trend is Sell on Rise keeping strict SL of 1556$
Buy above 1594 Tgt 1599 and 1604 SL 1585
Sell below 1581 Tgt 1576,1570 and 1563 SL 1585
Follow on Facebook during Market Hours: http://www.facebook.com/pages/Brameshs-Tech/140117182685863