


Bears kept ruling the Dalal Street for 5 week in row as Sensex and Nifty closed at 2013 low, with Nifty closing with cut of 2.2%. Union Budget got a Thumbs down from the market as it did not meet the market expectation. The sharp plunge in mid- and small-cap stocks on rumours of pledged shares of promoters being off-loaded, was the other sidelight of the week gone by. The BSE Mid-cap index lost 3 per cent, while the small-cap index lost over 5 per cent. Derivative expiry on Thursday turned out to be Highest turnover of 4.02 lakhs.We will be again following the cues from global market as domestic events are over. Services sector data and ECB, BoE meetings in focus from global perceptive.
Last week we gave Trend Deciding level as 5882 Nifty makes the high of 5878 and achieved all the weekly targets. Traders following Weekly trend deciding level should have minted good money.
Below is the chart of how Nifty performs post budget and picture from last few years have been if Nifty corrects before budget it continues the trend from next 30 days also. So pre budget we corrected almost 5% so March has a negative outlook going by previous year data.

Nifty Hourly Chart

Nifty is trading below 50 SMA which lies at 5798.As discussed last week On Hourly charts Nifty is forming a descending triangle with breakout below 5815 which got activated and target comes near 5650 which almost got achieved.
Nifty Gaps
For Nifty traders who follow gap trading there are 4 trade gaps in the range of 5400-6000.
- 5921–5943
- 5838-5854
- 5635-5658
- 5666-5651
- 5435-5526
Nifty Daily Chart
As seen in below chart Nifty after having broken the 8 months old Trend line green color and trendline from 4531 marked in red color, on both weekly and daily basis. The Red trendline was broken with a Gap down on Tuesday, so till 5854 is not see near term trend will remain bearish . As per classical technical analysis Resistance become Support.

5526 now become the most important and crucial support which needs to be watched closely in coming week.
Nifty Daily Chart with Indicators

Positive Divergence can be seen in Daily charts in RSI and Stochastic as seen in above chart. So bounce back should be expected from 5838-5815 range.
Fibonacci technique

As discussed earlier Fibonacci fan helps in finding potential tops and Bottom of market from short term prospective.We have used Weekly chart and applied Fibo Fans, Nifty was able to close below the Fibo Fans support of 5880 which is negative signs for Bulls, Next level of support comes at 5615
Fibo Retracement
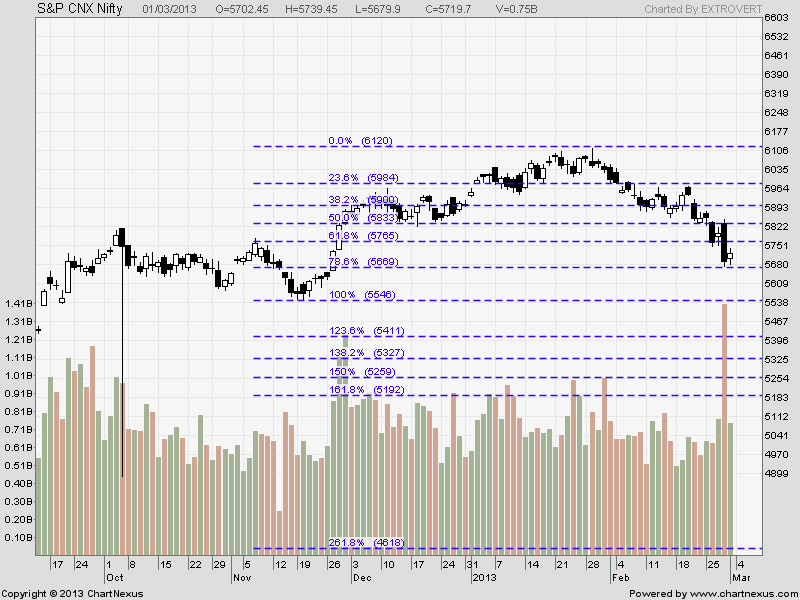
Nifty was unable to Hold the 50% retracement level,Now 5765 which is 61.9% retracement from 5547-6112 will become resistance in extremely short term, Support at 5672 .
Nifty Weekly Chart

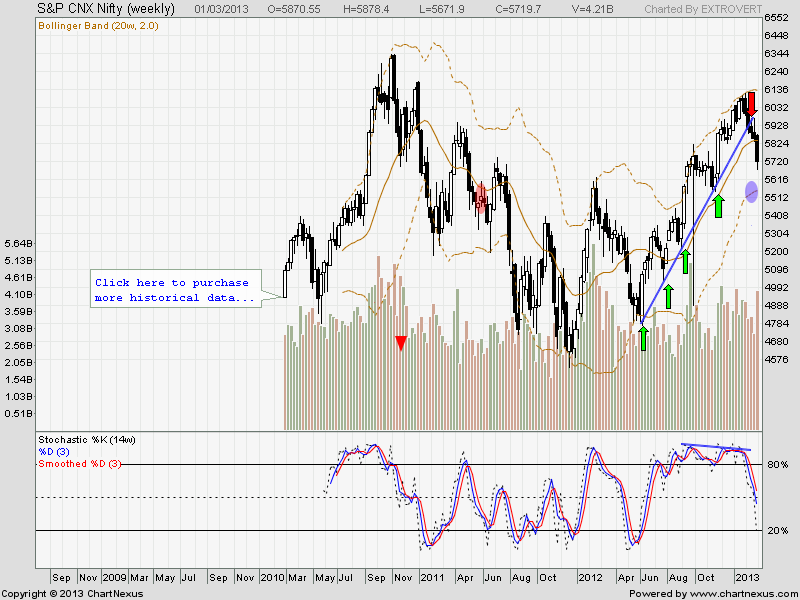
Trading Monthly charts

Monthly chart declined after taking resistance at 6112. Till Nifty does not cross 6034, Monthly charts will remain bearish.Monthly chart are now near important trendline support of 5672
Nifty Trading Levels
Nifty Trend Deciding Level:5765
Nifty Resistance:5820,5854 and 5911
Nifty Support:5672,5635 and 5550
Levels mentioned are Nifty Spot
Let me go by Disclaimer these are my personal views and trade taken on these observation should be traded with strict Sl
We do discussion is Live market to update Nifty levels If you are interested you can LIKE the page to get Real Time Updates.
Follow on Facebook during Market Hours: https://www.facebook.com/pages/Brameshs-Tech/140117182685863