


The RBI’s Fourth quarter monetary policy meet scheduled for the 19 March will also be keenly awaited by investors and traders. As CPI climbed 10.9 per cent in February from a year earlier, compared with 10.8 per cent in January, it has raised concerns about the extent of rate cut by the central bank on 19 March.Stock prices whipped in both direction in volatile week and Nifty ended down 1.2% or 73 points WoW basis.
Last week we gave Trend Deciding level as 5971 Nifty made the high of 5971 turned back, achieved all the weekly targets on downside. Traders following Weekly trend deciding level should have minted good money.
Nifty Hourly Chart

Nifty Hourly charts are trading in a crossover region of rising and falling trendline which signify volatile move in small range. Nifty is trading below 50 SMA @5905 and unable to breah the same before RBI policy day will put pressure on Nifty.
Nifty Gaps
For Nifty traders who follow gap trading there are 3 trade gaps in the range of 5700-6000.
- 5699-5722
- 5784-5792
Nifty Daily Chart
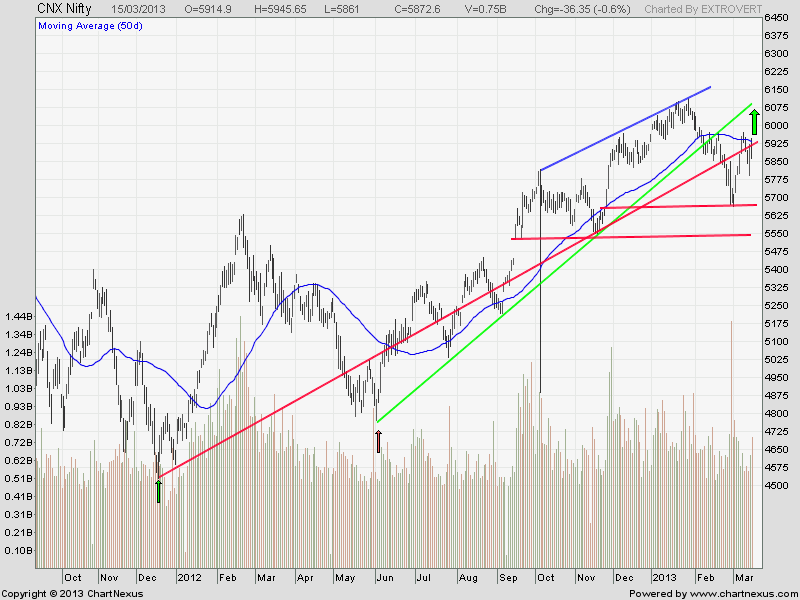
Nifty daily chart bounced from the red line support level as seen in below chart.Nifty is unable to break its 50 SMA on closing basis for 8 times in a rown from Feb 8, making 50 SMA@5937 as the zone of resistance for Nifty.Crossing the same Index has another test at 5971. On Downside below 5785 Index outlook turns bearish with the possibility of a decline to 5,679 or 5,511 in the upcoming weeks.
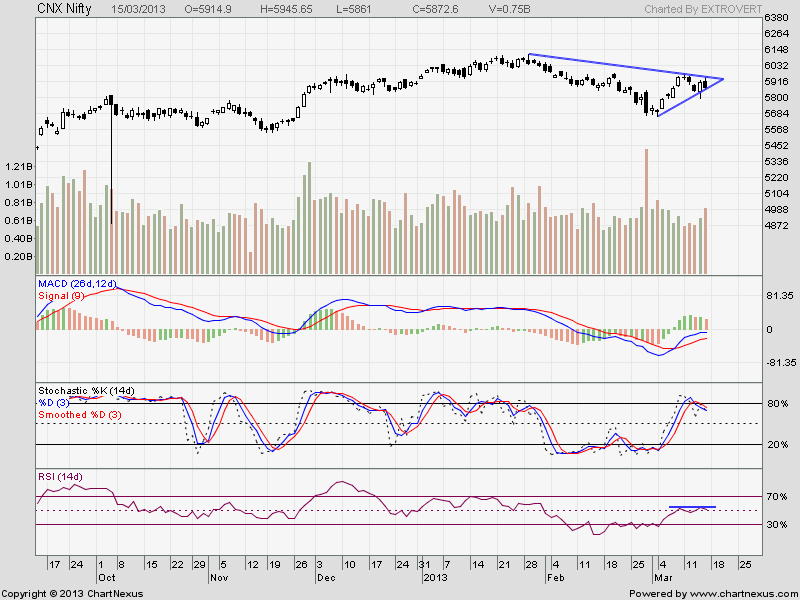
Nifty Daily Chart with Indicators
Daily charts has formed a symmetrical triangle formation which signify breakout above 5971/breakdown below 5842 is round the corner. Indicators are still in positive direction so Index can keep grinding in the range of 5840-5945 before the RBI policy.
Fibonacci technique
 Fibonacci Arcs are half circles that extend out from a trend line.Fibo arcs mark potential support or reversal zones to watch as prices pullback after the advance. After a decline, Fibonacci Arcs are used to anticipate resistance or reversal zones for the counter-trend bounce. Nifty has taken support at 38% or the 1 Fibo Arcs last week. Holding the same@5872 we can see a counter trend move till 5945-5971
Fibo Retracement
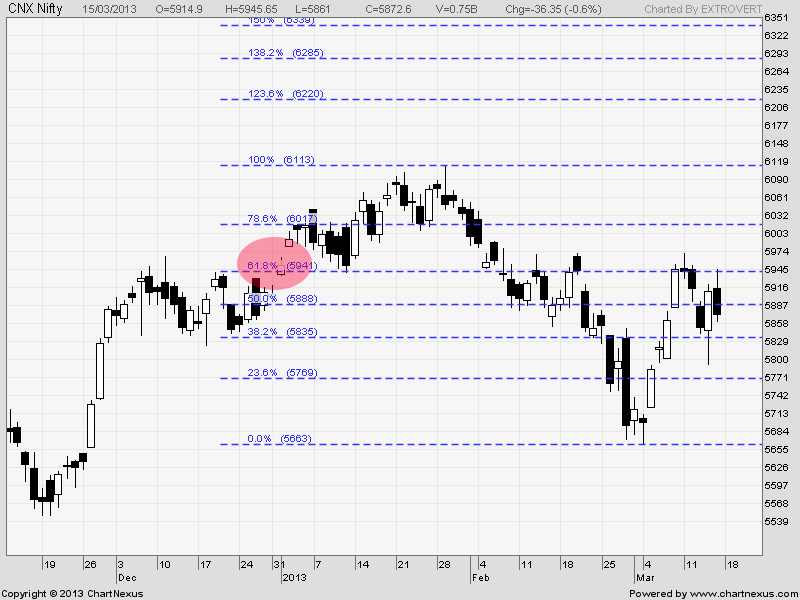
As per of Fibo Retracement theory Resistance at 5941 which is 61.8% retracement and Support at 5835
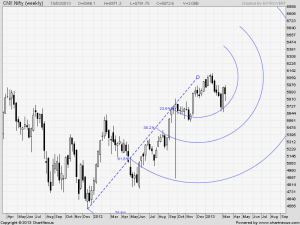
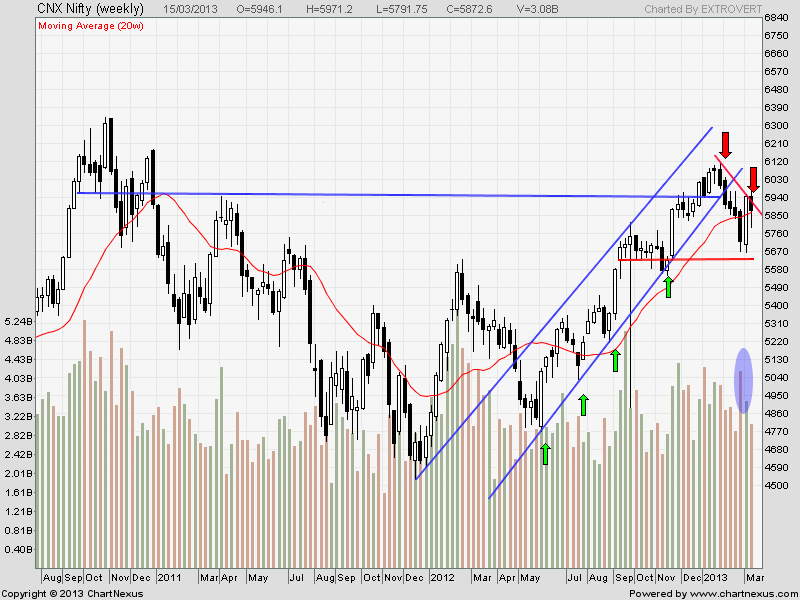
Nifty Weekly Chart
Trading Monthly charts
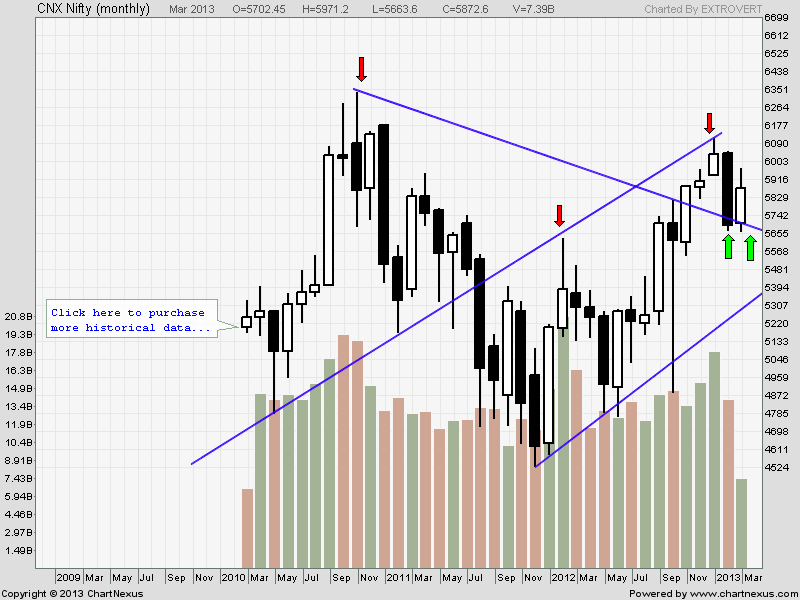
Monthly chart declined after taking resistance at 6112. Till Nifty does not cross 6034, Monthly charts will remain bearish.Monthly chart are now near important trendline support of 5672 as discussed last week and Nifty made a low of 5664 and bounced back. Analyzing Higher time is always beneficial for positional traders.
Nifty Trading Levels
Nifty Trend Deciding Level:5880
Nifty Resistance:5935,5971 and 6038
Nifty Support:5840,5784 and 5720
Levels mentioned are Nifty Spot
Let me go by Disclaimer these are my personal views and trade taken on these observation should be traded with strict Sl
We do discussion is Live market to update Nifty levels If you are interested you can LIKE the page to get Real Time Updates.
Follow on Facebook during Market Hours: https://www.facebook.com/pages/Brameshs-Tech/140117182685863
Dicey situation for nifty traders
thanks