


Bears kept ruling the Dalal Street for 2 week in row as Sensex and Nifty closed at 2013 low, with Nifty closing with cut of 1.5%, Mid Caps and Small caps got deeper cuts of 3% and 4% respectively. Economic data was not so encouraging with Goverment lowering GDP estimates and SEBI’s mandated minimum public shareholding of 25 per cent for private companies and 10 per cent for state- run firms, the promoters will have to sell their extra holdings in the market which will result in additional supply of equities in the market for the next few months.
Next week again tend to be lively with MCX-SX new Stock exchange will start trading, Headling Inflation and IIP data will be declared.Government has announced the Budget session dates, Railway Budget on 26 Feb and Annual Budget on 28 Feb which is also expiry day. So rise in volatility should be expected as the event comes near.
Lets discuss Nifty Trading Strategy for Next week.
Nifty Hourly Chart
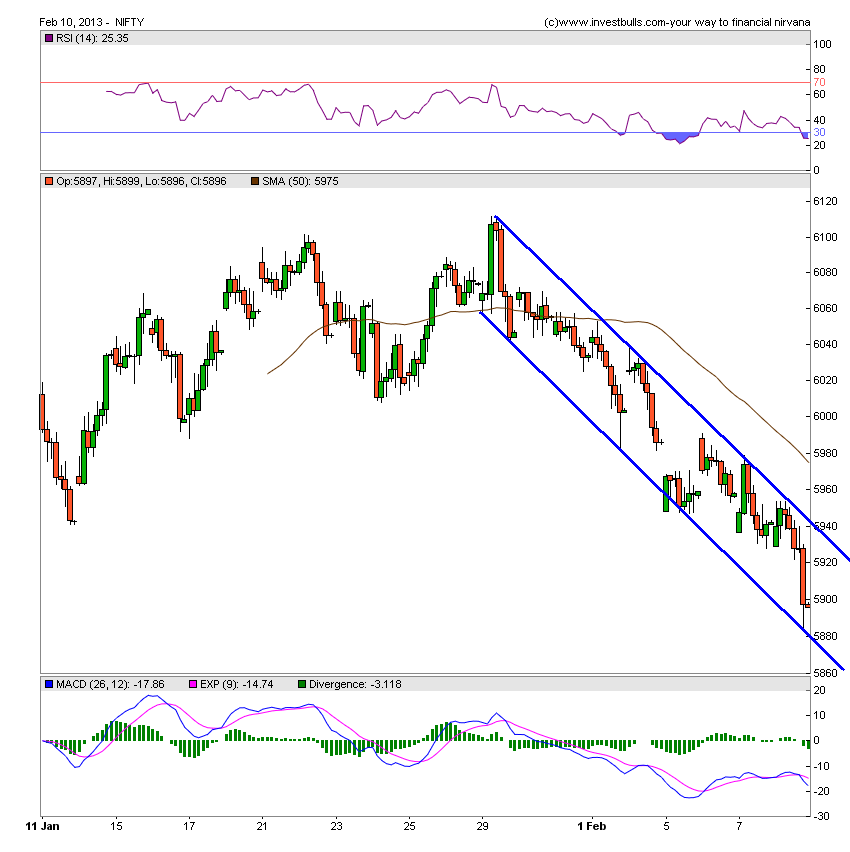
Nifty is trading below 50 SMA which lies at 5975. Nifty made a brief move above 6004 to fall back below Weekly Trend Deciding level of 6004 and made a low of 5883. Traders following weekly analysis would have been able to make some good money. Nifty has taken support at hourly channel and till 5883 is not broken bounce back till 5945 can be expected looking at oversold hourly charts.
Nifty Gaps
For Nifty traders who follow gap trading there are 4 trade gaps in the range of 5700-6000.
- 5727-5736
- 5856-60
- 5870-5880
So these levels should be noted down carefully by Nifty trader to find further Nifty support and resistance.
Nifty Daily Chart
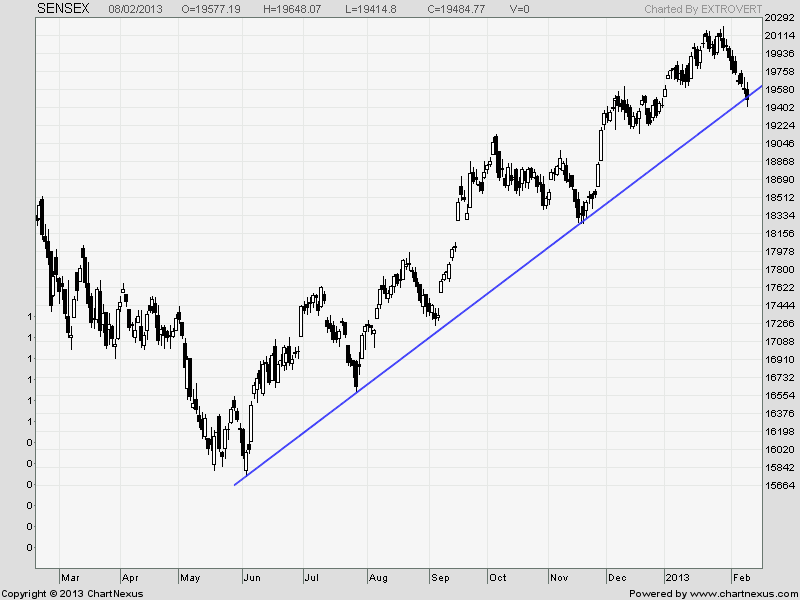
Technically till 6100 is not broken on closing basis Nifty will continue with its trend of Sell on Rise . This is what we discussed in Jan 25 analysis and Nifty made a High of 6112 after RBI rate cut and again turned back and made low till 5883 hope traders made use of analysis were able to benefit out of the fall.As seen in below chart Nifty has broken the Trend line green color which it was holding from the low of 4770, which is a bearish sign. But lets get a confirmation with Sensex also .

As seen in below Chart Sensex has not broken the trendline and closed above it. In recent history it has been observed many time Nifty giving whipsaws and Sensex following the trendline perfectly. So lets wait for Sensex also to break the trendline before increasing our bearish bets, Positional traders should atleast exit 50% of shorts.
Nifty Daily Chart with Indicators

MACD indicator gave a SELL RSI broke 50 and is down to 21 and Stoch is also in Sell mode. 5945 which was previous high should act as support, below that 5890. This is what we discussed last week and Nifty oblized us. Now break of 5883 is broken 5815 is on cards.
Fibonacci technique

As discussed earlier Fibonacci fan helps in finding potential tops and Bottom of market from short term prospective.We have used Weekly chart and applied Fibo Fans, Nifty has closed below the Fibo Fan support of 6040 on weekly basis. Next Support comes near 5890. So fall till 5890 can be expected if 6040 is not captured in next 2 days. As discussed last week 5883 came,Now break of 5880 fall till 5730 is on cards in next 2 weeks. Holding the 5880 bounce back till 6030.
Fibo Retracement

Next week Golden Ratio level of 5890 breaking of 5884 will lead further decline till 5825 and . Holding the same bounce back till 6030 is expected.
Nifty Weekly Chart
 Negative divergence in Stochastic is showing effects with Nifty on weekly charts on verge of breaking the support of converging trend lines at 5880.
Trading Monthly charts

Monthly chart declined after taking resistance at 6112. Till Nifty does not cross 6034, Monthly charts will remain bearish.
Nifty Trading Levels
Nifty Trend Deciding Level:5945
Nifty Resistance:5985,6034 and 6075
Nifty Support:5880,5845 and 5815
Levels mentioned are Nifty Spot
Let me go by Disclaimer these are my personal views and trade taken on these observation should be traded with strict Sl
We do discussion is Live market to update Nifty levels If you are interested you can LIKE the page to get Real Time Updates.
Follow on Facebook during Market Hours: http://www.facebook.com/pages/Brameshs-Tech/1