


HDIL
HDIL lead the carnage for Mid caps for 3 days in row. Stock is down 30% in last 3 trading sessions, as seen in chart below. It all started with HDIL VP selling 1 % promoter stake on Tuesday with deal valuing 57 cores. Market participants are thinking company is going bankrupt, VP has come on television and assured the sell is to fund land acquisition but market participant are not buying the story. Lets see how the technical of the stock looks like
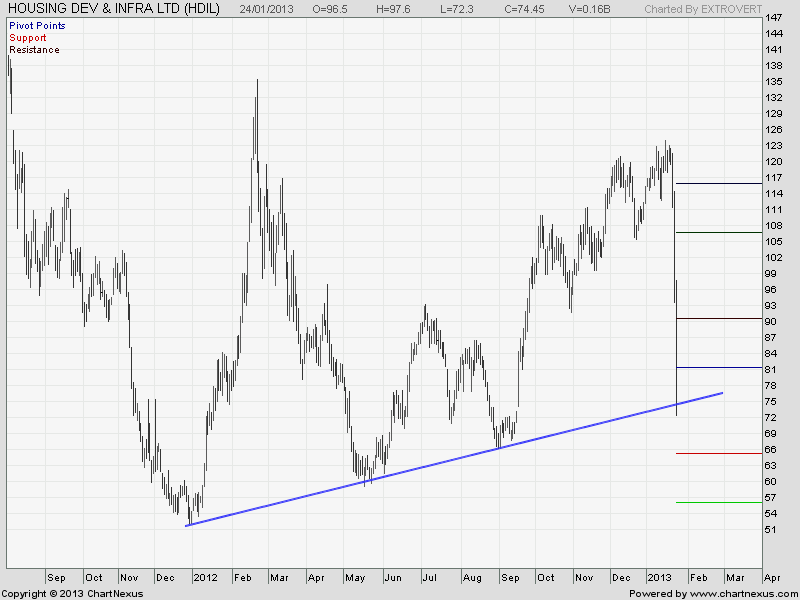
Above is the Daily chart of HDIL, stock has taken support at the 45 degree trendline, If support of 69-72 is held HDIL can give bounce back till 78 and 82 odd levels.
HDIL Fibo Fans
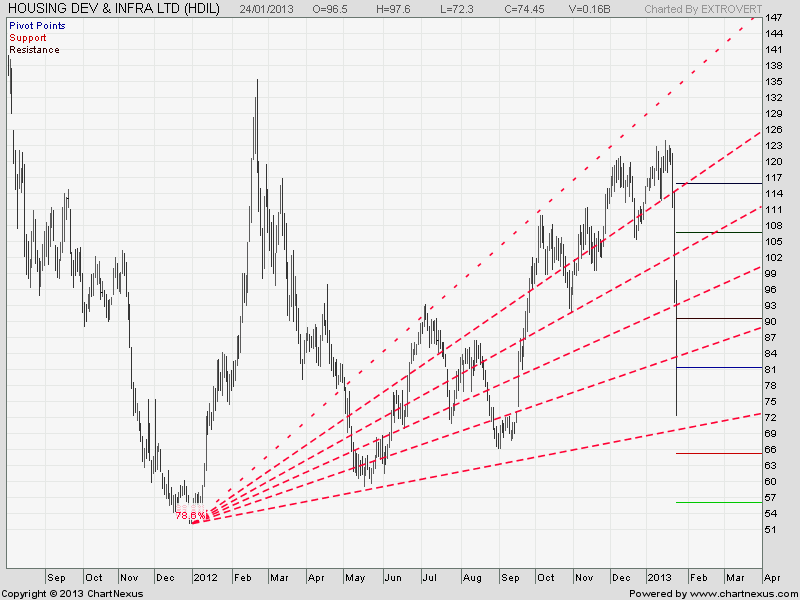
As per Fibo Fan theory HDIL can fall to 69 where support should come.failing to stop near 69 stock can further fall to 65,60 and 55 odd levels
HDIL Monthly Chart

On Monthly chart HDIL has habit of falling 33-40% on monthly basis. Jan 2011 stock was down 32% and now in Jan 2013 stock is already down 33%. Stock can further go down another 5-7% . Investor with risk appetite should take small exposure to stock near 69-65 odd levels.
Follow on Facebook during Market Hours: http://www.facebook.com/pages/Brameshs-Tech/140117182685863