


Q3 results, RBI’s monetary policy review will remain in focus next week and will decide the further trend of Nifty. Q3 numbers have been good till now with RIL and Maruti the major index beating street expectation, Next week ICICI and Rel Infra numbers will be in focus. This weak will be remembered for the butchering of mid cap stocks,HDIL IVRCL traders favorites stocks were down 10-25%. So eventhough Nifty is not correcting, retail traders can still feel the brunt of bears. FOMC meeting on 29-30 Jan will dictate the global markets as decision of Fed to cut on QE will be keenly seen by market participants (World Economic calender for coming weeks Event Calender )
Lets discuss Nifty Trading Strategy for Next week.
Nifty Hourly Chart

Nifty is trading comfortably above 50 SMA which lies at 6056. We had a volatile move in 93 points range in last week and with Nifty taking resistance at our Weekly Trend Deciding level of 6100 and falling all the way to 6007. Mid caps falling and Nifty also correcting and consolidation in small range before the monetary policy give a hint that rate cut is coming and Nifty will rally after rate cuts
Nifty Gaps
For Nifty traders who follow gap trading there are 4 trade gaps in the range of 5700-6000.
- 5727-5736
- 5856-60
- 5870-5880
- 5951-5982
So these levels should be noted down carefully by Nifty trader to find further Nifty support and resistance.
Nifty Daily Chart
Technically till 6100 is not broken market will continue with its trend of Sell on Rise . This is what we discussed in Jan 25 analysis and Nifty made a High of 6100 and again turned back hope traders made use of analysis were able to benefit out of the rally. Coming week we should be a breakout above 6100 or breakdown below 6000. As it is an expiry week also so lot of volatility is expected as traders will rollover there position also after RBI policy is announced.

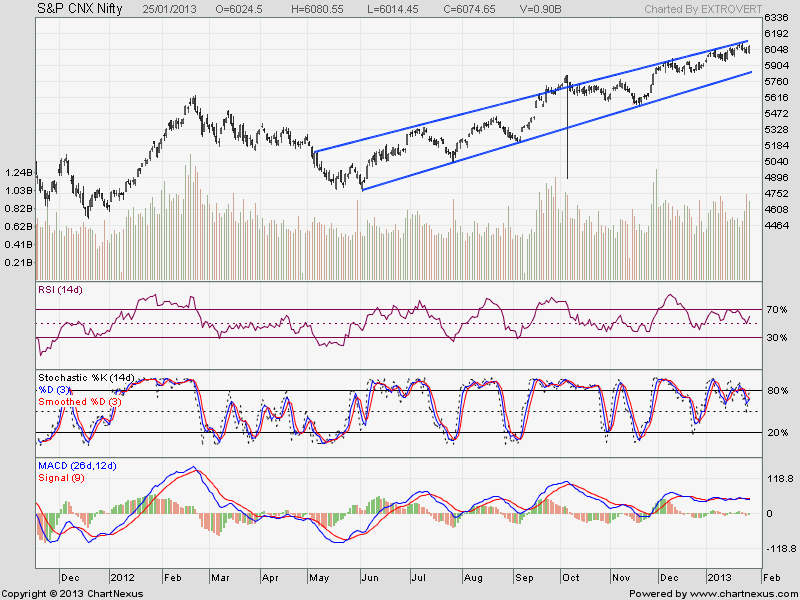
Nifty is also forming rising wedge pattern which is bearish once support coming at 6013 gets broken.
Nifty Daily Chart with Indicators
MACD indicator is going into sideways move and RSI took support at 50 and bounced back and Stochastic is on verge of giving positive crossover.
Fibonacci technique

As discussed earlier Fibonacci fan helps in finding potential tops and Bottom of market from short term prospective. If we see the chart closely with Fibonacci fans 6200 is level of resistance, and 6000 is level of support Nifty as per Fibo Fans.Nifty made low of 6007 and bounced back 🙂
Fibo Retracement

Nifty is consolidating around 80% retaracement 5545-6100.5990 will be a strong support for next week.
Nifty Weekly Chart

Trading Monthly charts

Monthly chart are approaching higher end trendline at 6100 closing above it will give a fresh breakout in monthly chart.
Nifty Trading Levels
Nifty Trend Deciding Level:6101
Nifty Resistance:6150,6180 and 6220
Nifty Support:6021,5968 and 5945
Levels mentioned are Nifty Spot
Let me go by Disclaimer these are my personal views and trade taken on these observation should be traded with strict Sl
We do discussion is Live market to update Nifty levels If you are interested you can LIKE the page to get Real Time Updates.
Follow on Facebook during Market Hours: http://www.facebook.com/pages/Brameshs-Tech/140117182685863
as you see weekly chart resistance came at 110-111 so why want to hold at 109. it in side way mode 200 day avg 105. never double you position/ never try to avg. it,it is better to set strict SL. as bramesh sir said ” in stock market, you can lose your money rapidly than gain it.” you can loose money fast than gain.”
in my opinion As per short term Tata Power is in trading Range,
From 104-112,
Try to add near lower leg and get rid of it at higher leg.
and if you see any breakout our breakdown in upcoming session you can take respective position on buy or sell side respectively.
Thanks Rahul for your valuable comment.
Rgds,
Bramesh
Sir,
Please can you give me your view on Tata Power. I hold one lot at 109
Dear Paminder sir,
Tata Power has strong support at 104, below that 101 will come.. Above 108 only bearishness will go off the stock..