


Fibonacci technique
Fib retracements
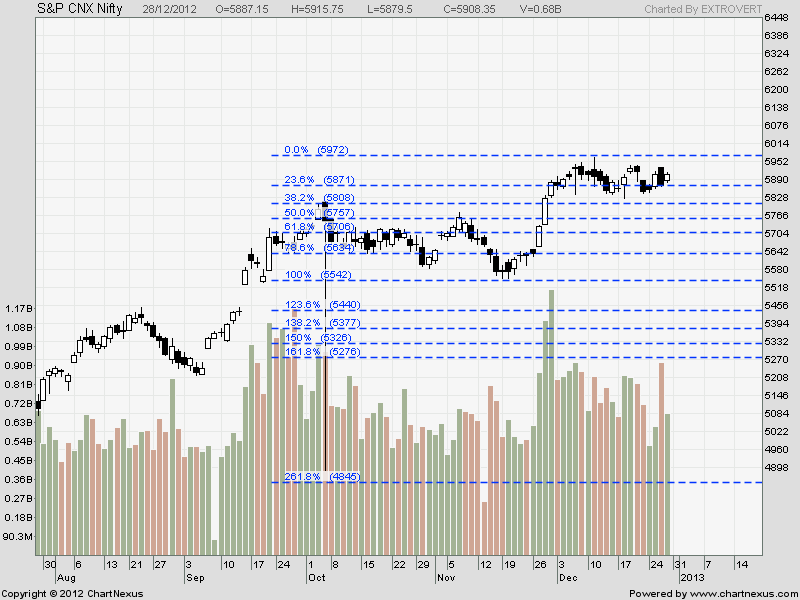
Fibonacci Ratios are drawn in above chart from 5548-5965 showing Fibonacci support and Fibonacci resistance. Close above 5965 is required for a breakout and support now exists at 5871and 5823.

As discussed earlier Fibonacci fan helps in finding potential tops and Bottom of market from short term prospective. If we see the chart closely with Fibonacci fans 5945-5963 is level of resistance, Nifty reacted from 5965 and now support is at 5850.
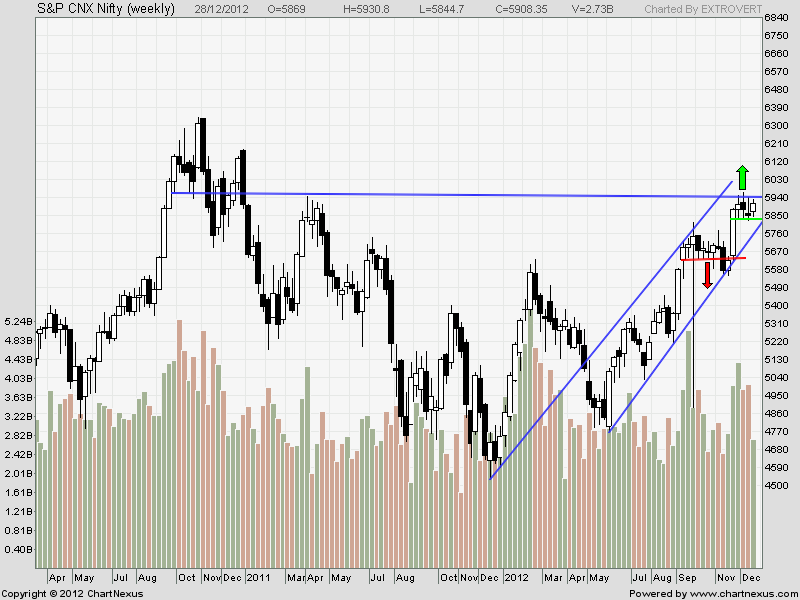
Nifty Weekly Chart

Trading Monthly charts

Close above 5217 is bullish for market for rest of year, I have been writing this for almost 6 months and Nifty has made almost 25% return for the Year 2012.Support on Monthly charts comes at 5787 and resistance at 5965.
Nifty Trading Levels
Nifty Trend Deciding Level:5930
Nifty Resistance:5965,6025 and 6069
Nifty Support:5888,5853 and 5820
Levels mentioned are Nifty Spot
Read the Weekly Analysis Part I
Let me go by Disclaimer these are my personal views and trade taken on these observation should be traded with strict Sl
We do discussion is Live market to update Nifty levels If you are interested you can LIKE the page to get Real Time Updates.
Follow on Facebook during Market Hours: http://www.facebook.com/pages/Brameshs-Tech/140117182685863