


Nifty and Sensex continued with there consolidation phase, positive takeaway from last week’s movement is that the Sensex is holding above 19,000 and the Nifty continues above 5,825 which gives bullish touch this phase of consolidation. Another positive which can be taken from the last week trading activity is full subscription of NMDC FPO with out much LIC help and full subscription of Bharti Infratel IPO.Not much satisfaction can be derived from the sharp increase in October industrial production numbers since it is mainly due to the low base last year. While consumer price inflation continued to be high, there was slight moderation in the Wholesale Price Inflation. Nifty F&O analysis is showing a bullish picture Lets discuss Nifty Trading Strategy for Next week.
Nifty Hourly Chart
Nifty continues to trade below the important 50 Hour SMA 5900 is the number to be watched for Monday.Till 5900 is not crossed bulls remain on backseat. Till 5825-15 is not broken convingly bears will remain on backseat. Basically we are in grinding range,best is to wait for the market to show direction before jumping into the trade.
Nifty Gaps
For Nifty traders who follow gap trading there are 6 trade gaps in the range of 5077-5900.
- 5043-5077
- 5238-5309
- 5303-5309
- 5399-5415
- 5435-5526
- 5635-5658
- 5666-5651
- 5727-5736
- 5825-5827
So these levels should be noted down carefully by Nifty trader to find further Nifty support and resistance.
Nifty Daily Chart
We clearly discussed 5950-80 is the zone of resistance in last week analysis, Nifty made a High of 5965 and turned back. Now the resistance of previous rise ie.5815-25 will become support for any downfall to come in Nifty. If one observe the Nifty cycle closely 10-12 trading session are spent in zone of consolidation after a rise of 200-250 points and after that we see a rise which last for 3-4 trading sessions. So till traders do not see a breakout/breakdown trade in less qty. Do not repent on losing 30-50 points but rejoice getting 150-200 points.

As per trend line analysis Nifty is regularly taking support at rising trendline from low of 4770. Till the trendline at 5715does not get broken nifty can continue its upward journey and close 2012 on a higher note.
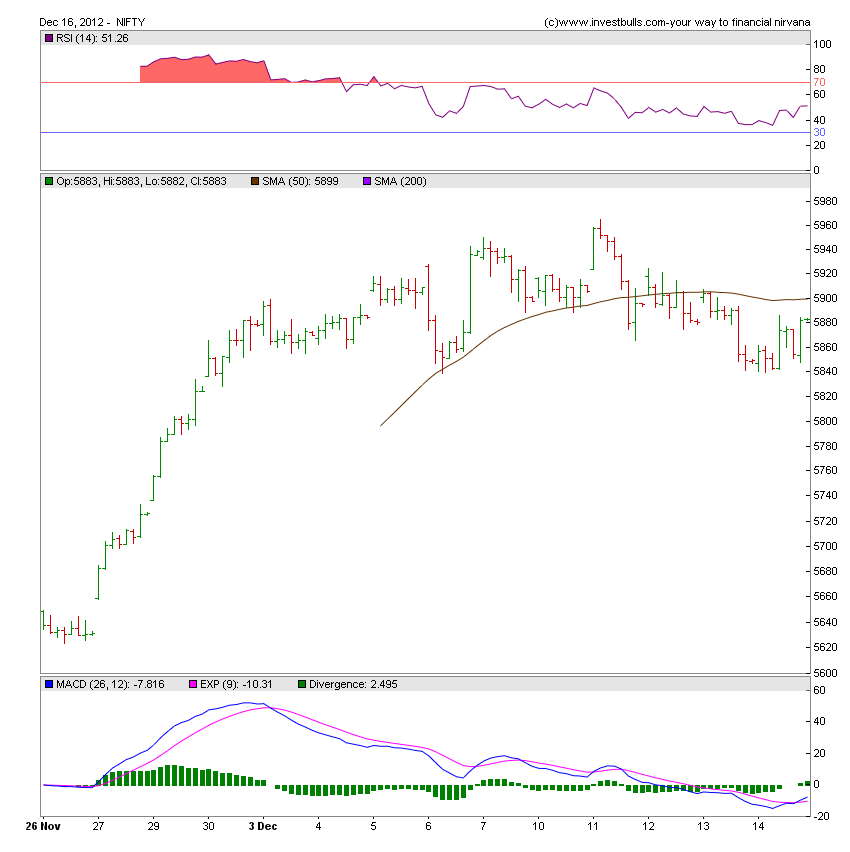
Nifty Daily Chart with Indicators

Trend line resistance has come up and unable to break 5950 next week in NS will invite correction in Nifty.Negative divergence are coming in both daily and weekly charts so trade with caution on long side. This is what we discussed last week and same held true Nifty went up till 5965 but turned back and corrected till 5839.
Continue Reading for Weekly Charts and Weekly Levels
Let me go by Disclaimer these are my personal views and trade taken on these observation should be traded with strict Sl
We do discussion is Live market to update Nifty levels If you are interested you can LIKE the page to get Real Time Updates.
Follow on Facebook during Market Hours: http://www.facebook.com/pages/Brameshs-Tech/140117182685863