US FED Ben Bernake has opened another bazooka for Bulls with QE3. Indian Goverment unleashed slew of Reforms from Diesel Price Hike and FDI in Aviation and Multi Brand Retail so the wheels of government has started turning up. Nifty is poised to open with another gap up on Monday as SGX Nifty closed at 5655. RBI meeting on Monday can add more fuel to rally if we have rate cut.
Whats in store for next week lets jump and see the Nifty technical outlook
Nifty Hourly Chart
Nifty Hourly charts is heavily overbought with RSI,MACD and Stochastic indicator consistently trading above 90. Overbought can remain overbought. When such big rallies come its always profitable to have look at higher time frames to catch the whole move. Monthly chart is still not overbought and Nifty can continue further with brief intraday corrections.
Nifty Gaps
Gaps formation in Nifty Daily chart pattern, 4 gaps in the range of 5077-5600. Do note the GAP formed on Friday was Breakaway Gap
- 5043-5077
- 5238-5309
- 5303-5309
- 5399-5415
- 5435-5526(Formed this week)
So these levels should be noted down carefully to find further support and resistance.
Nifty Daily Chart
Nifty took a perfect support at trendline from 4770 and started a fresh rally from 5217. Last 2 times we had rally of
- 578 points (5348-4770)
- 416 Points (5448-5032)
so looking at history and calculating as per Ratio theory target for this rally comes at 5516 time frame will be less than 20 trading days.
This is what we had discussed last week and Nifty made a close above 5516 and target achieved as per ratio theory.
As per trendline shown in below chart Next supply zone or resistance comes in range of 5630-5648.
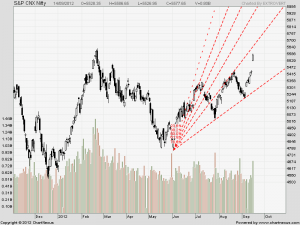
Nifty Fibo Fans
Nifty Fibo Fans are an Ultimate tools to find tops and Bottom and next level of resistance comes at 5650 so monday gap u should not be used to go long immediately take trade after RBI policy and Intraday Range given on Facebook page.
Nifty Fibo Retracement
Nifty Fibonacci Retracements from 4531-5630 are drawn in above chart,Close look at the same reveals strong support at 5434 levels which is 50% retracement. Bull markets should hold 50% retracement.Major resistance at 61.8% Golden ratio at 5648. So pullback should come if 5648 is not breached.
Nifty Weekly Chart
Nifty was up 4.1% WoW basis, now approaching crucial trendline resistance of 5600 . Close above it can further fuel the rally on Upside till 5850 as seen in below Nifty Weekly chart.
Nifty Monthly Chart
Close above 5217 is bullish for market for rest of year..Support on Monthly charts comes at 5448.As shown in below chart September is month of Big moves and we have moved 6.1% till date going by average we can see another 3-4% move which means 200 points on Nifty can further be added to current rally as per historical data of Nifty.
Nifty Trend Deciding Level:5648
Nifty Resistance:5704,5753and 5803
Nifty Support:5587,5540 and 5500
Let me go by Disclaimer these are my personal views and trade taken on these observation should be traded with strict Sl
We do discussion is Live market to update Nifty levels If you are interested you can LIKE the page to get Real Time Updates.
Follow on Facebook during Market Hours: http://www.facebook.com/pages/Brameshs-Tech/140117182685863


