


July expiry closed with a loss of 106 points to June and August series started with a bang with Nifty making a high of 5149 but selling off in later half of session.Macro concerns regarding health of Indian economy and huge sell off in mid caps following margin funding problem lead to deterioration of sentiments. Mid caps were butchered in last 2 sessions as most of them were down between 20-45% in 2 sessions. Rumors of Ketan Parik and Kolkatta Brokers going bankrupt were talk of D-Street but no materialist evidence was present.
Investors can use these opportunity to buy mid caps like Amar Remedies, Parshvanath in pyramid format.
The week ahead would be news-heavy with the RBI and the Federal Reserve holding their monetary policy meetings next week. Progress of monsoon, PMI numbers and earnings announcements will be other drivers in the short-term.
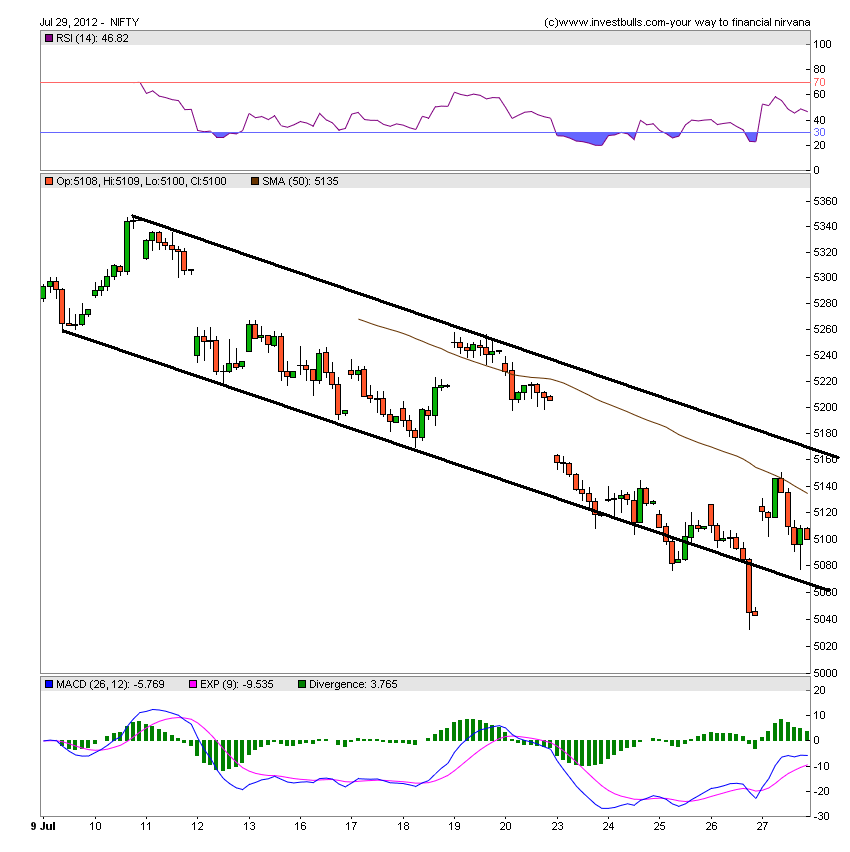
Nifty Hourly Chart

Nifty Hourly Charts are trading in a parrell channel with an aberration last 30 mins of expiry when Nifty broke the channel but quickly came into the channel on Friday. 50 Hour SMA at 5135 is the resistance and any move above it will take us back to the top of channel at 5200.
Nifty Gaps
Nifty has formed the following 4 gaps in the range of 5077-5350
- 5345-5236
- 5306-5267
- 5205-5167
- 5043-5077
So these levels should be noted down carefully to find further support and resistance.
Nifty Daily Chart

On Daily charts nifty is forming an symmetrical triangle. Height of triangle comes 5348-5200= 148 point, and low made by nifty on 5043 so target got achieved.Any move above 5167 will lead to gap filling. Analysising Nifty charts now semms to be seeing a small cap chart with lot of gap up and small candles followed by big candles.

Nifty Spot trading channel in a parallel channel with breakout above 5175 and breakdown below 5040
Nifty Fibo Fans

As i discussed few days before Fibonacci fans are a wonderful tools to find swing Top and swing bottom of Nifty, As shown above 5043 seems to be swing bottom as per Fibo charts.
Nifty Fibo Retracement

Nifty Fibonacci Retracements from 4770-5350 are drawn in above chart,Closer look at the same gives that Nifty has been consolidating in the range of 50% retracement at 5060 and 61.8% retracmenet at 5127.
Nifty Weekly Chart

Contracting triangle with resistance at 21 Week ema at 5152 and trading between a parallel channel with Hammer Candlestick formation which is a reversal pattern,Close above 5152 will give more weightage to this pattern.

Rising Wedge pattern on Weekly charts,which became active with breakdown below 5285 and eventually touching 5043 as we saw the follow up action once 5169 got broken.
Nifty Monthly Chart

July Month will come to end in 2 trading sessions Close above 5217 is bullish for market for rest of year.Monthly Charts of Nifty is giving resistance at 5339 break of same will lead to a move till 5445.Support on Monthly charts comes at 4932
In Nutshell:Daily charts are giving a Bullish sign till 5043 is not broken,Weekly charts are signalling Sell on Rise with sl 5179 and Monthly chart closing above 5217 will be bullish for Nifty for August month.
Nifty Trend Deciding Level:5135
Nifty Resistance:5167,5205 and 5232
Nifty Support:5077,5043,5000 and 4967
Let me go by Disclaimer these are my personal views and trade taken on these observation should be traded with strict Sl
We do discussion is Live market to update Nifty levels If you are interested you can LIKE the page to get Real Time Updates.
Follow on Facebook during Market Hours: http://www.facebook.com/pages/Brameshs-Tech/140117182685863
Auto Update Pivot and Caramilla Pivots Sheet :http://niftystockpivot.blogspot.in/
Dear Bramesh,
Thanks for clarifying the one doubt, but 2nd one remain unanswered i.e how in your hourly chart 8 candle sticks are displaying for each day while it should be 7 ( 1. 9:15 to 10Hr, 2. 10 to 11Hr, 3. 11 to 12 Hr 4. 12 to 13Hr 5. 13 to 14 Hr 6. 14 to 15 Hr, 7. 15 to 15:30 Hr)
Thanks and regards
Dear Bramesh,
As usual, once again I am asking a very silly question, this time regarding Nifty hourly chart as I am of the opinion that the things look easy are most difficult in nature, so it is always better to have the opinion of the expert of the subject for clarification. That is why I am raising the question to you as under:
It is my observation that total 8 candlesticks are displayed in one day interval of hourly chart in your anylysis.
Market hour starts from 9:15 hours and ends at 15:30 hrs i.e. it remains open for 6 Hrs 15 Mins for trading.
Shall appreciate If you please let me know
1. How you define the first hour i.e from 9:15 to 10:00 or 9:15 to 10:15 or some other time span and similarly for last half hour.
2. How it completes 8 Candlestick in whole day trading with what time span
Thanks and regards.
Dear Sir,
The above question answer depends upon the trading system setup you follow.
Traders consider 9:15-10 AM as first hour and continue the same till 3 Pm and 3-3:30 as a separate candle.
Some traders consider 9:15-10:15 as 1 hour.
Bottom line there is no hard and fast rule all depends on how much flexible you are and what makes your system.
Rgds,
Bramesh
how is gap left on 5043-77?
Please see the opening on Friday and Closing on Thursday
Rgds,
Bramesh