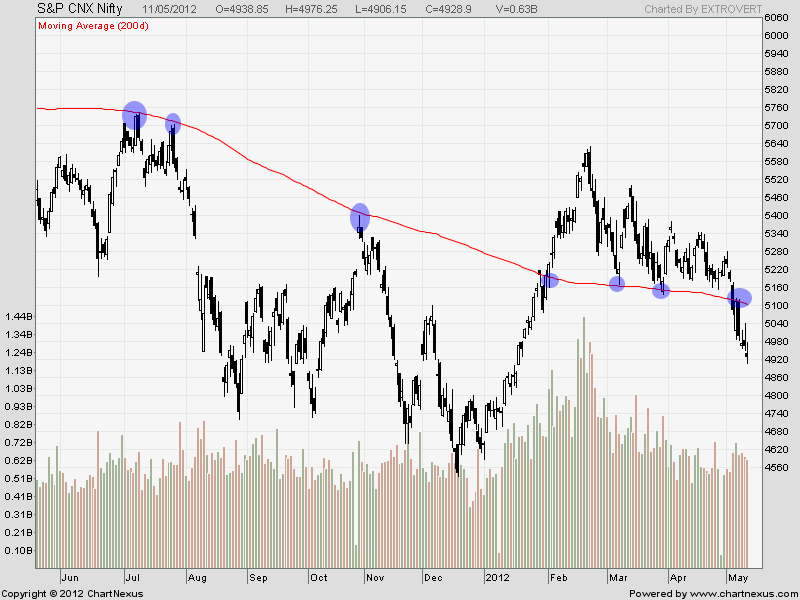
As discussed in last week analysis Nifty Technical Structure look weak and Nifty corrected and closed below 200 DMA on a Weekly Closing basis. GAAR has been delayed by 1 Year and we got a news based rally which got sold into showing the supremacy of Technical Analysis.Last Week we shorted below trend deciding level of 5070 and Nifty stopped its downmove on our last support level at 4905.Click Here to Read the Previous Week Analysis
Election results in France and Greece have once again triggered Euro debt worries as voters have overwhelmingly rejected austerity measures in favor of anti-austerity leaders.Greece is heading for another elections and if anti austerity party gains full majority Greece will mostly be out of Eurozone.
Will it be Lehman Moment ?
Some Good news for Bulls
Peoples Bank of China cuts Reserve Ratio Requirement by 50 bps to 20% effective from 18th May 2012.A 50 basis-point cut in the reserve requirement in February probably added 400 billion yuan ($63.4 billion) to the financial system
Nifty Hourly Chart
 Hourly Charts are trading below both 20 and 50 HSMA and Bears inability to fill the gap from 4905-4880 shows bulls are buying at lower levels. Any move above 4995 can trigger a relief rally for next week till 5103 odd levels where the Bulls strength will comes to test.
Nifty Daily
On Daily charts we have broken the lower sloping trendline of 14 month@4995. This setup indicate bearish stances if 4995 is crossed next week. On Downside trendline targets comes at 4820 and 4720 for the current downmove.
As i have mentioned many times Below 200 DMA Bears rule and above 200 DMA Bulls rule. It is such a simple trade set up but still we try to complicate things. See the Blue circles i have mentioned How 200 DMA act as resistance in Bear markets and Support in Bull market.
Nifty Gaps
Nifty has the following gaps so any close below 5000 will lead to gap filling so keep a close eye on the gap levels mentioned below 1 got filled in current week and still 3 are pending.
1 Gap :4641-4676
2 Gap:4744-4772
3 Gap:4879-4905
4 Gap:4947-4991 — Filled
Nifty Fibonacci
As per Fibo levels from 4531-5630 we have closed below 61.8% at 4950 If nifty some how closes below 4767 we are in for a swift down move which can go till 4531 or below it. Try to be with the trend,IT our human emotion when market is rising we want to short and when market is falling we want to take longs. Basically its emotional trading which happens when you do not have proper system to trade with.
Nifty Weekly
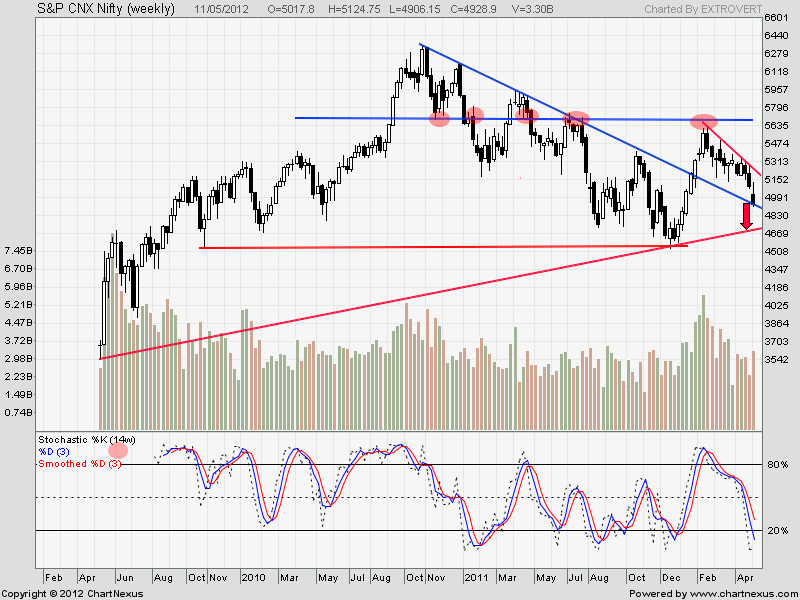
 On Weekly charts Nifty closed just above the lower slopping trendline from high of 6335. Close below 4905 will lead to gap filling till 4880 and trendline targets comes at 4720. So as per Daily hourly and Weekly charts 4700-4730 is emerging as a Strong support so keep an eye on this range if and when it comes.
We got the whiff of bearish stance of Nifty with a close below 50 WSMA and it showed it effect this week. Also we closed below the upper flag trendline. Next week we need to see if Nifty can creep over this Flag or will invalidate this pattern.
Nifty Monthly
I have been discussing that theory of Sell in May and Go away It was based on facts. See the arrow in above chart Mostly may are down between 3-8%. Now we are down 6% for May month. Can it bleed more till it trading below 4995 its quiet possible.
Nifty Trend Deciding Level:4995
Nifty Resistance:5067,5103,5162
Nifty Support:4905,4880,4827 and 4751
Let me go by Disclaimer these are my personal views and trade taken on these observation should be traded with strict Sl
We do discussion is Live market to update Nifty levels If you are interested you can LIKE the page to get Real Time Updates.
Follow on Facebook during Market Hours: http://www.facebook.com/pages/Brameshs-Tech/140117182685863


Hello Bramesh,
Could you please explain how you have calculated GAP?
Dear Sir,
Regarding “Sell in May & go away”, I have to put some historical facts as under :
a) White candlesticks year for May Month were 2001, 2003, 2005, 2007 & 2009
b) Black Candlesticks Year for May Month were 2002, 2004, 2006, 2008, 2010 and 2011.
So all odd years were for White-candle formation except May 2011 while all even years were for Black-candle formation, so is doing till date in May2012.
But remember still half month is left and as 2011 was exception for previous trend, so same may happen with May2012 also.
Please notice the same scenario in last days of May,2010, When 50 SMA was > 200 SMA, Nifty could not remain more than 6days below 200SMA after breaching it by 200 points and then from June,2010 remain Bullish till mid of Nov,2010.
So is the case this time too. 50 SMA > 200 SMA. 4 days have past below 200 SMA on closing basis,Long term support line is lying at 4848, still in Correction mode in a bullish market, on weekly chart still above 200SMA, China Cash reserve cut by 50bps……
So we have to observe, whether history will repeat again………..
Thanks and regards
CM Gupta