The Week Ended up with the inevitable,long due and bold decision by S&P Rating agency: Downgrade of EU Nations
Standard & Poor’s carried out a mass downgrade of euro zone countries on Friday, stripping France and Austria of their top-grade AAA ratings, Nine of the 17 members of the euro area had their credit ratings cut by S&P. France and four other countries suffered a one-notch downgrade while Portugal, Italy, Spain and Cyprus were cut by two notches.
The decision of S&P will have impact on Europe Financial Stability fund (EFSF) as its Credit Rating will also be downgraded as France was big lender for EFSF fund and its rating has been downgraded to AA.
Next Week main event to watch
- ECB President Draghi’s Speech
- Bond Sale of EFSF fund on Tuesday How market react to it ?
- Monday being an Holiday for US market so its EU news and Stock markets reaction which needs to be watched closely.
HAPPY Pongal & Makara Sankranthi to all Blog Readers
Lets move to technical of Nifty
Nifty Hourly
On Hourly chart Nifty is forming Rising Wedge formation which is bearish for short term. 4910 will be the point of invalidation for the rising wedge formation. There is persistent negative divergence on hourly charts. There are 2 Gaps on charts as pointed out in above chart which needs to be watched closely on any downside.
Gap 1:4768-4742
Gap 2:4676-4636
Nifty Daily
On Daily charts Nifty is moving into overbought zone as per Stochastic and negative divergence on RSI. Nifty has corrected on Friday from the resistance level of 4900-4910. As daily chart looks overbought so a correction can commence next week. EU downgrade can be the potential trigger for the correction.
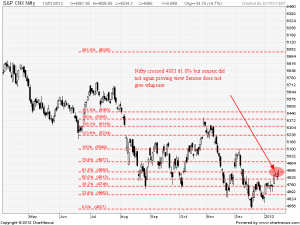
Nifty Fibonacci Resistance Whipsaw while Sensex did not gave the whipsaw
I has talked about the importance of 4883 as its 61.8% retracement level of 4532-5099 and it got crossed on Friday Afternoon,but unable to close above it.
Lets look at the sensex chart for the same time frame and to my surprise
Sensex did not crossed the 61.8% Resistance
 Nifty might give whipsaw but sensex never give the same. It has happened many time before but wanted to share this instance with the readers.
Nifty Weekly
On Weekly chart Nifty again reacted from trendline resistance and till Nifty does not close above 4910 medium trend remains down.
Nifty Monthly
On Monthly chart Nifty again reacted from trendline resistance which shows supply pressure coming on weekly and monthly chart. Caution with longs.
One more observation is from january Small Cap and Mid Cap Index is up 11% while Nifty is up 5% which means Midcaps have outperformed the Nifty.
Any Bear market will never end with Mid caps and Small Cap outperforming Nifty so i will consider the following rally as Bear market rally.
Nifty Trend Deciding Level:4804
Nifty Resistance:4910,4945,5010
Nifty Support:4741,4686,4617


Good call on maruti sir, can we but at CMP also?
As a trader i would not suggest to hold longs or do a fresh entry in maruti.
Rgds,
Bramesh
nifty correct in next two weeks and down to4484-4424
can you please suggest me trade for 16/01/12 in maruti, hindalco & jp associate?