The RBI has thrown everything in its arsenal at stubborn inflation. But prices refuse to budge. The latest food inflation number, based on the wholesale price index, came in 10.6% higher from a year earlier. All eyes are now on the central bank, who meets 25 Oct to decide its latest monetary policy stance. Is 13 the lucky number for the RBI, or will it stop after a dozen rate hikes? 12 rate hikes and a 5% increase in policy rates have done nothing to dampen inflationary pressure. Since it hasn’t succeeded at cooling inflation, maybe easing its aggressive stance to not damage growth further may be a better option.
But, since its prime responsibility is to tame inflation, India may not be out of the woods just yet.
We have interesting Expiry ahead as 3 Important events are scheduled ahead:
1. ECB Meet and announcement by France and German FM how will they save the EURO
2. RBI policy meet on 25th Oct to decide the Rate Hike. 25 BPS has been factored in the market.
3. The Spirit of Festival season ahead — Diwali the Festival of Lights and Mahurat Trading session on 26 OCt
Lets see how Nifty looks technically before these important events.
Nifty Hourly
On Hourly Charts Nifty is trading in a channel with lower support at 5025-35 levels and facing resistance at 5120-40 levels. It is forming a contracting triangle which gives indication of either breakdown or breakout is in near future.
The events we have discussed above will help in the breakout and breakdown but never trade in anticipation of certain levels.
Many traders buy and short sell in anticipation of breakout or breakdown but when trade goes against them, Unable to exit the trade and which will lead to ultimately to Loss.
Nifty Daily
As i have explained in previous analysis range of 5016-35 is very good support for market and each time market corrects this range comes on rescue on downside and Nifty bounces. Currently we are trading in sideways market with 5011-5169. Break on any of the levels will bring another fast and furious move of 158 Points(5169-5011) in next 2 weeks.
5011-158 = 4842(This will lead to gap filling on downside Gap of 4861-27 is still not filled)
5169+158= 5327 ( This will lead the Gap filling of 5230-5320 range)
Any upmove or down move which will come as per levels discussed will be explosive in nature and hence do not get stuck with the wrong trade.
 Volumes are higher on rising day and Lower on Falling day which indicated the internal strength of market is bullish and is more biased on long side and Every dip is getting bought.
But any uncertain events like EU not coming to any conclusion will lead to break on downside with biggish volumes.
Simple Rule:Till Market do not closes below 50 DMA its buy on dips. Every fall will be bought
Nifty Weekly
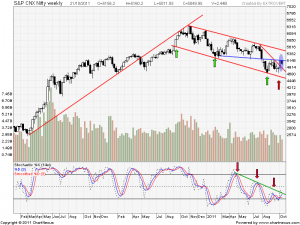
 On Weekly charts we are still in formation of Higher High and Higher Low formation with Biggest resistance at 5169. Again on Weekly charts the Volumes are much less as compared to previous week. Nifty is down 1.6% on WoW basis.
Weekly trendline indicating the weekly resistance at 5169. Market is unable to break this range after 4 times.Weekly support comes at 5011-4998 range.
Will it be 5th Time lucky? Next week first 2 days will resolve this mystery.
Last Week was a Bad Luck to bulls as so near the range they were unable to close above 5169.
Exciting and thrilling week ahead of us.
Its been 11 Weeks ahead we are trading in a range bound market with huge trading range of 450 points.
Nifty Monthly
5169 is monthly high of September month and 5160 is Monthly high of October month. Above it a fresh breakout again is on cards.
Nifty Open Intrest
Nifty OI Chart (http://bramesh-niftyoi.blogspot.com/) As per Open Interest Charts 5200 CE has highest OI and it become wall of resistance.
If nifty move above 5200 Levels it will lead to Huge Unwinding of calls and explosive move of 30-50 points in matter of min will happen. 5000 PE will act as support on downside.
Nifty trading Levels:
Trend Deciding Level:5169
Resistance:5198,5230,5278 and 5320
Support:5035,4998,4975,4924 and 4896
Please let me know if any improvements required in analysis and I am welcome to feedbacks as this will help me in improving the charts presentation.
Follow on Facebook during Market Hours: http://www.facebook.com/pages/Brameshs-Tech/140117182685863


@pratik i do nt use the system wht ur saying and will nt be able to comment on the same.
@rishi i do track Uflex
Good analysis. keep it up.
i have some idea but how to apply that i don’t know its a ratio of change in the price of option to change in price of stock.
good analysis sir what is delta heading and how to use in real market as well in any software? recently i heard ashwini gujral and sudarshan shukhani are using this now a days.
AWESOME DETAILED ANALYSIS……KEEP IT UP….
DO U TRACK UFLEX ??
Super analysis
Thanks All for your appreciation.
Rgds