HI All,
I was not in best of my health from past 3 days reasson for no updation on site.
Thanks all for showing concerns by calling on cell and sending mail.
Reliance
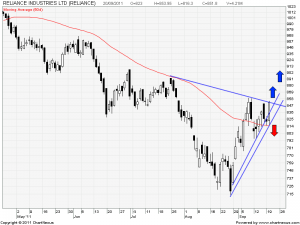
RIL the poster buy on Nifty has woken up again yesterday and reason for 100 point jump in market.Volumes are point of concern as with a 4% rise volumes were only 4.21 million. So there was a short covering in futures which induced the rally.
Looking at Daily chart above 854 levels stock will do its breakout from down trending trend line. Failure of the same will lead to stock to sub 800 levels.
Buy above 854 Tgt 859,865 and 875
Sell below 840 TGt 827,814 and 803
State Bank of India
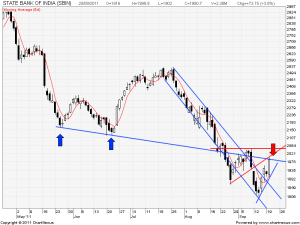
SBIN again the star of yesterday rally rose till 2000 again problem with volumes.4% rise with volumes of 2.38 Million shares .
Volumes plays a crucial role as it gives the confirmation of brakout or fake breakout.
SBI is again near its resistance of down trending line of 2000 which if not broken than again stock will again go below 2000 its a vertical trend line the stock is rising on.
Buy above 2000 Tgt 2026,2047 and 2062
Sell below 1964 Tgt 1940, 1928 and 1900
Infosys
 Infosys and IT stocks are rallying on slide in rupee. A 1 Rupee fall in add 50 bps to the margin of infy.
Only concern is how much hedge they have taken data of which is not available in public domain.
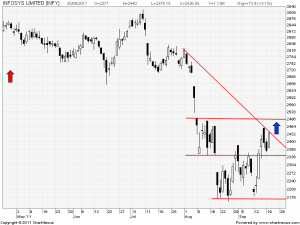
Technically speaking It has again taken resistance at falling trend line and cross over of which can take the move till 2500 rs.
Buy above 2440 TGt 2460,2482 and 2501.
Above 2501 Violent move can take Infy back to 2524 level where there is a runaway gap.


TAKE CARE OF URSELF BRAHMESH SIR
Thanks a lot sir..