Bombay Dyeing
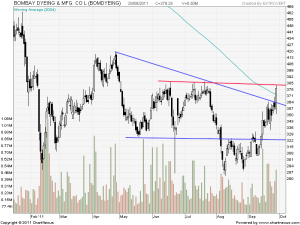
 Bombay Dyeing has it given a break out ?
Looking at daily chart Stock has broken above its upper trending line and 200 DMA with volumes but..
200 DMA is dividing line between BUlls and Bears. Below 200 DMA bears rule and above 200 DMA BUlls do party.
The most important level to confirm breakout id 386-387 above which only if Bombay dyeing closes Breakout gets confirmation and Stock can very well move till 419 levels.
Buy above 387 Tgt 397,404 and 419
Sell below 371 Tgt 363,359 and 351
Mundra Port SEZ
 Our Reader Mr. Rohit has asked levels for Mundra Port. Above is the daily chart of the same.
Stock is giving a range bound move 130-166 Levels.Got resisted 3 times at 166 as marked in the chart.Volumes are not so high near this levels of 166 so again stock got sold off for 3 time.
Till stock is trading above 161 on closing basis the recent uptrend will continue if broken stock again will go down and touch the lower end of trading range ie. 130in short term.
Buy above 167 Tgt 171 and 176
Sell below 161 Tgt 158,152 and 146
Reliance
 Off Late RIL has been quiet volatile and giving moves more than 2% on a daily basis. I covered RIL 2 days before mentioned the importance of 803 levels.RIL closed above that yesterday and made a High of 813.
It has formed a triangle on daily chart which is ready to breakout above 813 levels.
Buy above 813 Tgt 818,827 and 847
Sell below 801 Tgt 790,784 and 773
Larsen and Tubro
 Never Catch a Falling knife…..
Larsen is apt for this scenario, An unintreputed fall from high of 1673 to low of 1348.
I have presented the Weekly chart of LT.Lower Lows are getting formed on both daily and weekly charts.
Stock has taken support at 1348 which was its long term support.Hence a Rally can be expected with indicators deeply oversold.
For Long term Investors Watch out for 1301 and 1248 levels if Stock is not able to Hold this level in October month,Get your money ready to buy it between 1100 Levels as election gap will be filled as soon as 1248 breaks on closing basis.
Buy above 1373 Tgt 1393,1410 and 1426
Sell below 1344 Tgt 1320,1300 and 1248

and also i want to add something about larsen. 52 week high 2212 and if we use fib ratio 2212*38.2%=845
2212-845=1367 so above this must buy and yesterday’s closing was1369 so one can buy with srong sl with 1367 closing basis.
Fibo are always good in finding support but i have more firm belief on trend lines and demand supply concept so use them as 1 tool in my analysis…
Thanks for your perceptive also it helps a lot ..
Rgds
THNKS BOSS FOR YOUR ADVICE
RDGS
ROHIT PATEL
Hope it helps !!
sir there is also head and sholder in lt if i m not wrong