Nifty continued its upward journey fulled by FII inflows and clocked up another 3% gain for the week.After 8 days of rally Nifty finally closed in red this friday.Nifty has been on dream run taking everyone by surprise but this is how market dynamics. Market always does the unexpected .
Hourly Charts
On Hourly chart immediate resistance is 5865 expiry day high this should be taken out next week for further upside,If market is unable to break this level than we will make a double top and it will be a case bearish implication.
Looking at Hourly charts we are moving in a channel and break below this channel only can build a case for downside.Break of 5786 is important for Shorter till than it is buy on Dips market.
Nifty 5 EMA and 20 SMA on hourly and daily charts is still a buy.Reversal will come once the 5 EMA crosses 20 SMA on downside.
Daily Chart
On Daily Chart Fibonacci Resistance from High of 6339 and low of 5177 is shown below.
61.8% Fibo resistance comes at 5895 which is immediate resistance on daily charts.This levels needs to be watched closed next week.
Trendline Resistance is coming @5920 which is another resistance.So far overbought conditions have been corrected with intraday moves. Nifty is now under clutch of resistance and moves ahead requires some good news and heavy FII buying.
If India win world cup can this be a trigger 🙂 (pun intended )
Weekly Chart
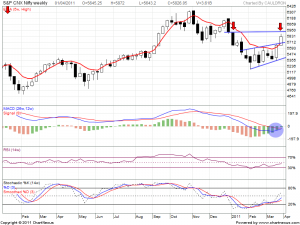
On Weekly charts We have broken the trendline resistance and now heading for 5920.
 MACD is giving a crossover and will generate a BUY STOCH is in BUY Zone.
Nifty Weekly Pivot:5780
Resistance:5917,6009
Support:5688,5551


