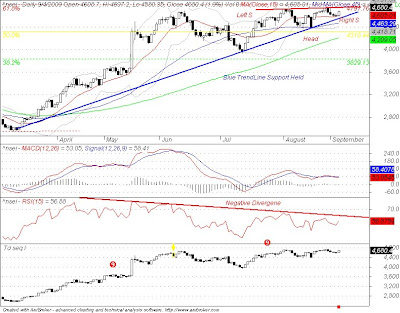
Nifty Daily charts are Attached. Following Conclusions can be drawn for the week gone by and predictions can be made for the coming week.
1. The Blue line which is trendline held the support and we did not broke the 4575-80 Band We touched it thrice and than gave a good bounce on Friday
2.Nifty is above 5 EMA and 5 WMA which gives good possibility to make a new high and probably move towards 4800-900 levels.
3. Weekly Pivot at 4664 Resistance at 4757 4834 Support at 4590 4499 4422
4. Point to be noted is 61.8% retracement is at 4791 which will be a diffcult levels to cross once that is crossed except good shorting which can propel nifty to 100 points in a day.After that we can accept a Profit Booking.
5. Negative divergence in RSI is a cause of concern for bulls.But as Oscillators adn Indicators are lagging indicators so can be negated for the time being.


