


GAIL
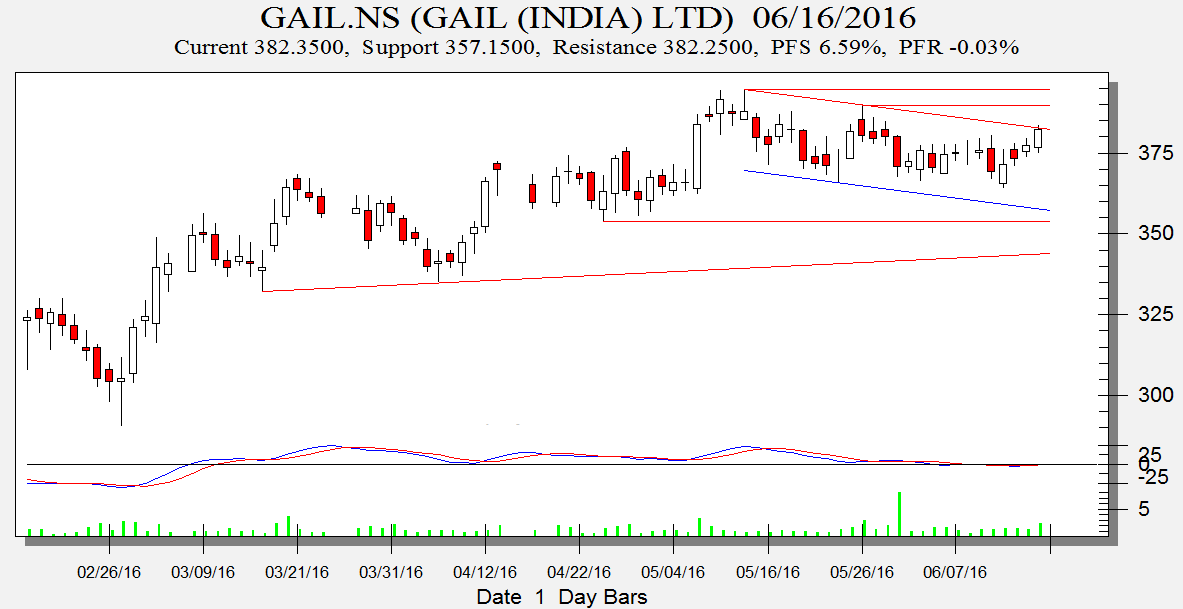
Positional Traders can use the below mentioned levels
Close above 390 Tgt 398
Intraday Traders can use the below mentioned levels
Buy above 386 Tgt 388,391 and 395 SL 384
Sell below 380 Tgt 377,375 and 371 SL 382
CESC
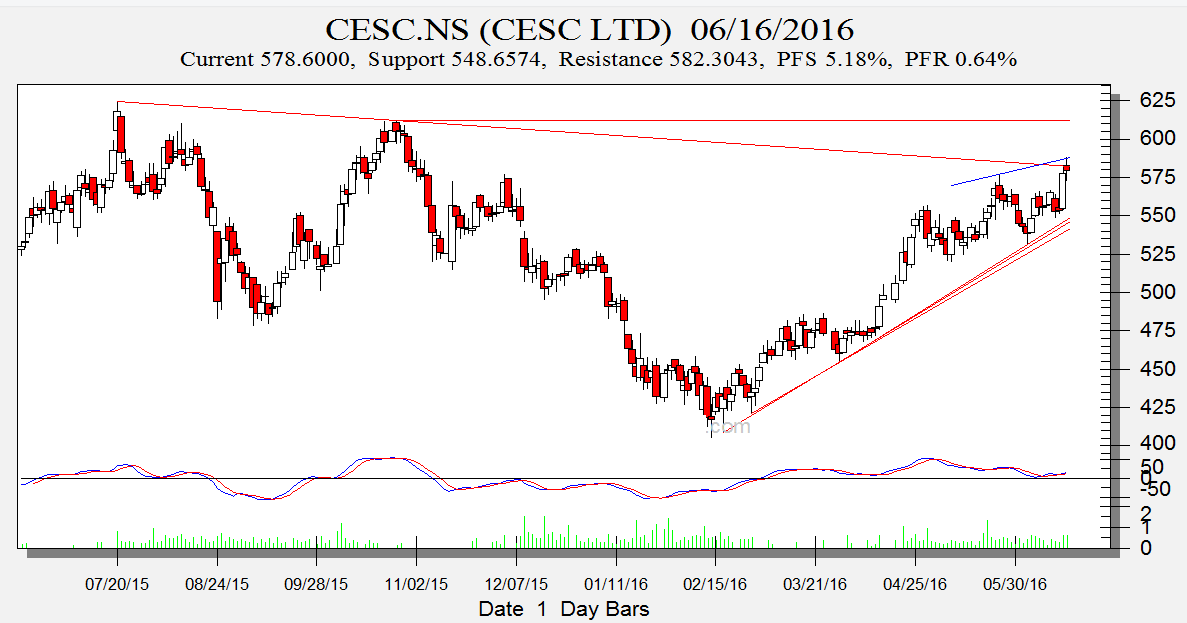 Positional Traders can use the below mentioned levels
Holding 576 Tgt 589/597
Intraday Traders can use the below mentioned levels
Buy above 581 Tgt 585,590 and 595 SL 578
Sell below 576 Tgt 572,568 and 564 SL 579
Canara Bank
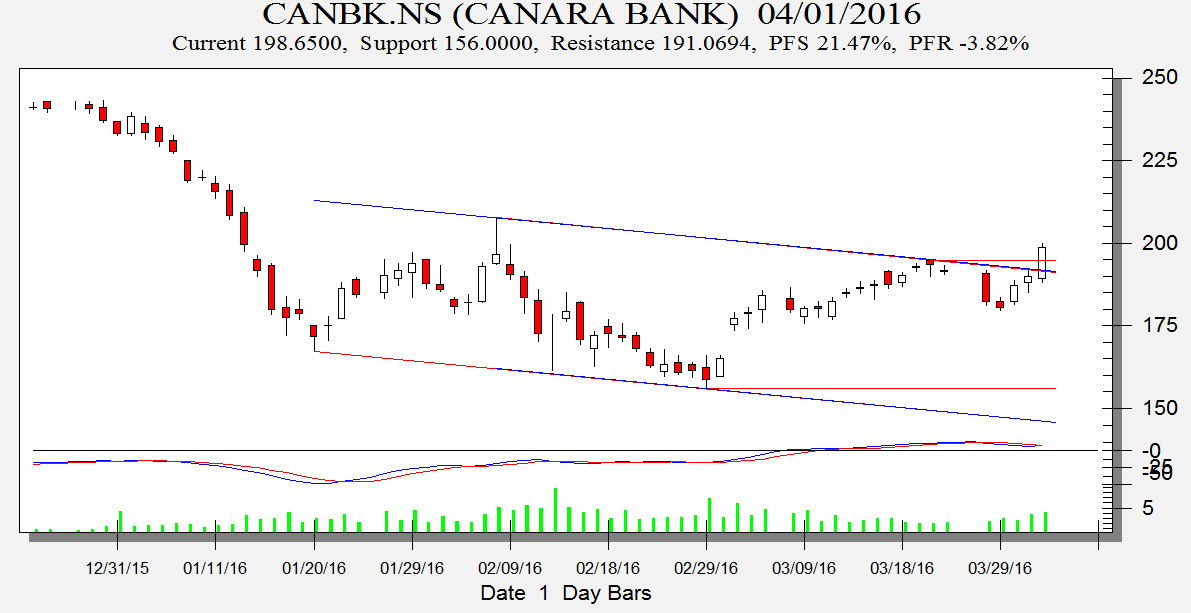
Intraday Traders can use the below mentioned levels
Buy above 204 Tgt 206,209 and 212 SL 202
Sell below 201 Tgt 198,196 and 194 SL 203
How to trade Intraday and Positional Stocks Analysis — Click on this link
Performance sheet for Intraday and Positional is updated for April Month, Intraday Profit of 2.31 Lakh and Positional Profit of 3.48 Lakh. Please note we do not have any “ADVISORY Service”, I share this sheet to see how the system are performing and money can be made in Stock Market if System are followed with discipline. Also the performance differs from trader to trader.
http://tradingsystemperformance.blogspot.in/
http://stockpositionaltrading.blogspot.in/
- All prices relate to the NSE Spot/Cash Market
- Calls are based on the previous trading day’s price activity.
- Intraday call is valid for the next trading session only unless otherwise mentioned.
- Stop-loss levels are given so that there is a level below/above, which the market will tell us that the call has gone wrong. Stop-loss is an essential risk control mechanism; it should always be there.
- Book, at least, part profits when the prices reach their targets; if you continue to hold on to positions then use trailing stops to lock in your profits.
Follow on Facebook during Market Hours: https://www.facebook.com/pages/Brameshs-Tech/14011718
In your journal,you have written CESC stop loss triggered(1000 rs loss),But by the EOD it closed above 576 and has reached your target the next day!Shoulnt it be a profit of 13000?
thanks for clarifying seems typo error will get it corrected..
Hi Bramesh ji, i want to thank you for educating novice investors like me, I recently started F&O, and taking one step at a time, i made good profits in canara and gail today, but made a small loss in cesc, overall, it was a great day.
Sir, im one of ur gr8 admirer and most of the time try to invest on share suggested by you. Im from kolkata & i find CESC to be fundamentally vvery strong as they ar the only player without any competition and we are paying almost Rs 7 to 9 per unit for power usage. I dont know about their balance sheet as im not so qualified to understand it but the kind of money they ar charging is exorbitant. I want to trade in this share regularly. Could u pls let me know in what range it generally trades & what should be its strict stoploss. A brief comment on CESC would be highly appreciated. Thanks & Regards.
For extreme Short term Range seems to be 555-610.. I would request you to make a plan and trade accordingly..
CORRECTION:- cesc selling tgt change it, not 368,
thanks..