


As discussed in last Analysis Gold is coming near Sun Planneatry line,formed Inside Bar on Weekly chart suggresting price contraction has take place and range exapnsion will be seen in coming week. 52000 done and Price Reacted from Sun Plannearty line.
GOLD Gann Angle Chart
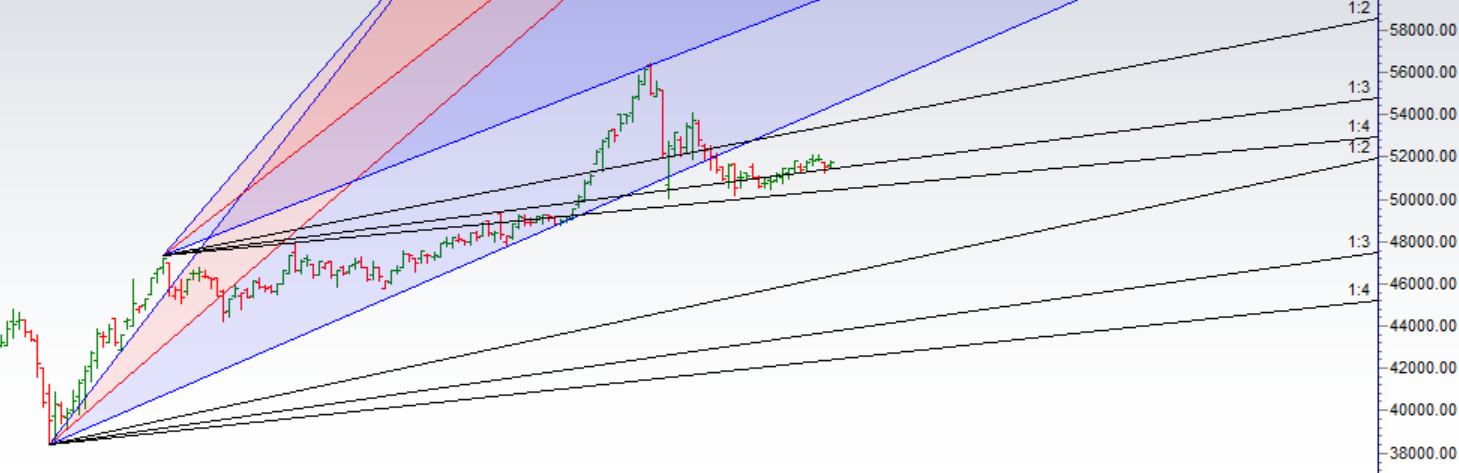
Bounced from Gann Support line
GOLD Plannetary Support and Resistace Line

Sun Planneatry line is acting as a resistance,Bulls made another attempt towards Sun Planneatry line red color but failed to close above it.
GOLD Harmonic Analysis

As discussed in last Analysis Price coming near 50000 can be a good entry for long trade as per harmonic pattern,Low made last week was 50629. 52000 done.
GOLD Pressure Date
22 Sep Important time cycle date.
Weekly Trend Change Level:51681
Weekly Resistance:51900,52182,52600
Weekly Support:51300,51000,50700,50333
Levels Mentioned are for Gold Oct Future
Bramesh Bhandari
Technical Analyst, Trader, and Educator publishing daily market geometry, W.D. Gann levels, and financial astrology cycles since 2008. Creator of custom TradingView Pine Script scanners for Nifty, Bank Nifty, Gold, and Global Indices.