


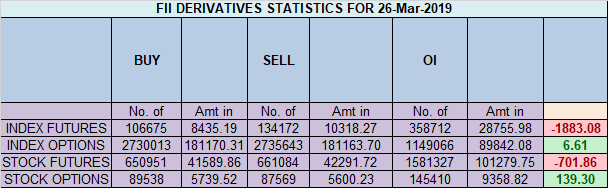
- FII’s sold 27.4 K contract of Index Future worth 1883 cores 3.8 K Long contract were added by FII’s and 31.3 K Short contracts were added by FII’s. Net Open Interest increased by 35.2 K contract, so rise in Nifty was used by FII’s to enter long and enter short in Index futures.FII’s Long to Short Ratio at 1.55. Strong Emotions in Trading
- As Discussed in Last Analysis Bears will have upperhand till we are below 11400 for a move towards 11276/11230. Bulls will get active above 11400 for a move towards 11450/11510. 26 March is also important time cycle. 26 March was important day as its was confluence of 2 cycle and once 11400 was taken out bulls were having upper hand and rallied towards all our target. Fresh long should be taken above 11525 for a move towards 11578/11610. Shorts will get activated below 11400 for a move back to 11352/11300.
- Important intraday time for reversal can be at 10:58/1:34/2:43. Bank Nifty rallies on Time Cycle date

- Nifty April Future Open Interest Volume is at 1.10 core with addition of 31 Lakh with increase in cost of carry suggesting long position were added today, NF Rollover cost @10868 closed above it,rallied 620 points.
- 11600 CE is having Highest OI at 24.3 Lakh, resistance at 11600 followed by 11700 .11000-11600 CE liquidated 38 Lakh in OI so bears covered position in range of 11500-11600. FII bought 5.8 K CE and 429 CE were shorted by them. Retail sold 120 K CE and 57.6 K shorted CE were covered by them.
- 11400 PE OI@ 30 Lakhs having the highest OI strong support at 11400 followed by 11300 . 11000-11600 PE added 15 Lakh in OI so bulls added position in range 11300-11400 PE.FII bought 10.3 K PE and 21.3 K PE were shorted by them. Retail bought 90.1 K PE and 49.7 K PE were shorted by them.
- Total Future & Option trading volume at 11.71 Lakh core with total contract traded at 1.58 lakh , PCR @0.82
- FII’s bought 999 cores and DII’s sold 196 cores in cash segment.INR closed at 68.94 USD/INR Technical Analysis
- Nifty Futures Trend Deciding level is 11433 For Intraday Traders). NF Trend Changer Level (Positional Traders) 11261 How to trade Nifty Futures and Bank Nifty Futures as per Trend Changer Level
Buy above 11500 Tgt 11525,11551 and 11578 (Nifty Spot Levels)
Sell below 11440 Tgt 11417,11390 and 11364 (Nifty Spot Levels)
Follow on Twitter:https://twitter.com/brahmesh
Follow on Facebook https://www.facebook.com/Brameshs-Tech-14011718268586
Youtube Channel: https://www.youtube.com/channel/UCxTIpotKybyOQIDsS3eEqhQ
About the Author
Bramesh Bhandari
Technical Analyst, Trader, and Educator publishing daily market geometry, W.D. Gann levels, and financial astrology cycles since 2008. Creator of custom TradingView Pine Script scanners for Nifty, Bank Nifty, Gold, and Global Indices.
Educational Disclaimer: Content is strictly for educational purposes and is not SEBI-registered investment advice. Trading involves risk.