


Ashok Leyland
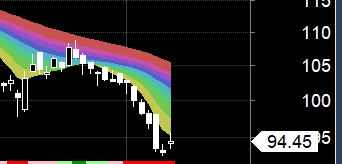
Positional Traders can use the below mentioned levels
Close above 95.5 Target 99/103
Buy above 95.5 Tgt 96.6,97.6 and 99 SL 94.5
Sell below 94 Tgt 93,92 and 91 SL 94.5
Bank Baroda
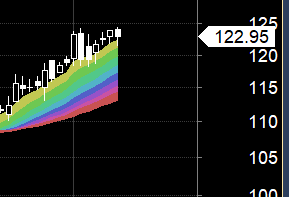
Positional Traders can use the below mentioned levels
Close above 125 Target 133/136
Buy above 125 Tgt 126,127 and 129 SL 124
Sell below 123.5 Tgt 122,121 and 119 SL 124.5
NIIT Tech
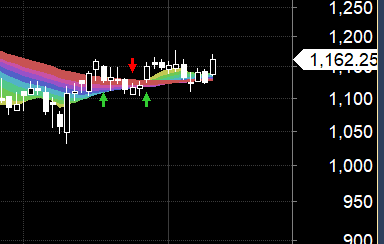
Positional Traders can use the below mentioned levels
Close above 1165 Target 1200/1222
Buy above 1165 Tgt 1175,1185 and 1200 SL 1157
Sell below 1154 Tgt 1145,1135 and 1122 SL 1161
How to trade Intraday and Positional Stocks Analysis — Click on this link
Performance sheet for Intraday and Positional is discussed for Dec Month, Intraday Profit of 3.19 Lakh and Positional Profit of 5.37 Lakh. Please note we do not have any “ADVISORY Service”, I share this sheet to see how the system are performing and money can be made in Stock Market if Trading Systems are followed with discipline. Performance “Will differ” from trader to trader.
http://tradingsystemperformance.blogspot.in/
http://stockpositionaltrading.blogspot.in/
- All prices relate to the NSE Spot/Cash Market
- Calls are based on the previous trading day’s price activity.
- Intraday call is valid for the next trading session only unless otherwise mentioned.
- Stop-loss levels are given so that there is a level below/above, which the market will tell us that the call has gone wrong. Stop-loss is an essential risk control mechanism; it should always be there.
- Book, at least, part profits when the prices reach their targets; if you continue to hold on to positions then use trailing stops to lock in your profits.
Follow on Facebook https://www.facebook.com/Brameshs-Tech-14011718268586