


Kajaria Ceramic

Positional Traders can use the below mentioned levels
Close below 440 Target 427/418
Intraday Traders can use the below mentioned levels
Buy above 445 Tgt 450,455 and 461 SL 441
Sell below 440 Tgt 437,433 and 425 SL 444
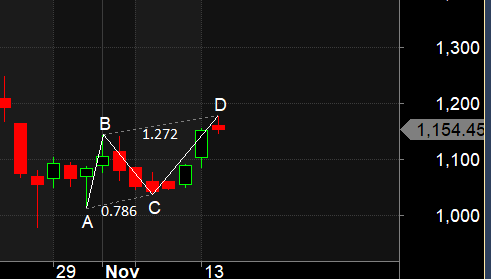
Jubilant Food
Positional Traders can use the below mentioned levels
Close below 1143 Target 1090
Intraday Traders can use the below mentioned levels
Buy above 1158 Tgt 1170,1181 and 1193 SL 1150
Sell below 1143 Tgt 1133,1122 and 1111 SL 1150
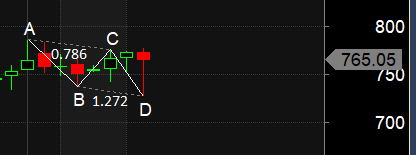
Raymond
Positional Traders can use the below mentioned levels
Close above 777 Target 806
Intraday Traders can use the below mentioned levels
Buy above 777 Tgt 785,792 and 800 SL 772
Sell below 765 Tgt 757,750 and 741 SL 772
How to trade Intraday and Positional Stocks Analysis — Click on this link
Performance sheet for Intraday and Positional is discussed for Oct Month, Intraday Profit of 4.48 Lakh and Positional Profit of 5.95 Lakh. Please note we do not have any “ADVISORY Service”, I share this sheet to see how the system are performing and money can be made in Stock Market if Trading Systems are followed with discipline. Performance “Will differ” from trader to trader.
http://tradingsystemperformance.blogspot.in/
http://stockpositionaltrading.blogspot.in/
- All prices relate to the NSE Spot/Cash Market
- Calls are based on the previous trading day’s price activity.
- Intraday call is valid for the next trading session only unless otherwise mentioned.
- Stop-loss levels are given so that there is a level below/above, which the market will tell us that the call has gone wrong. Stop-loss is an essential risk control mechanism; it should always be there.
- Book, at least, part profits when the prices reach their targets; if you continue to hold on to positions then use trailing stops to lock in your profits.
Follow on Facebook https://www.facebook.com/Brameshs-Tech-14011718268586