


- FII’s sold 4.5 K contract of Index Future worth 249 cores ,2.7 K Long contract were covered by FII’s and 1.7 K Short contracts were added by FII’s. Net Open Interest decreased by 941 contract, so fall in market was used by FII’s to exit long and enter short in Index futures. FII’s Long to Short Ratio at 0.63. Trading a New Account
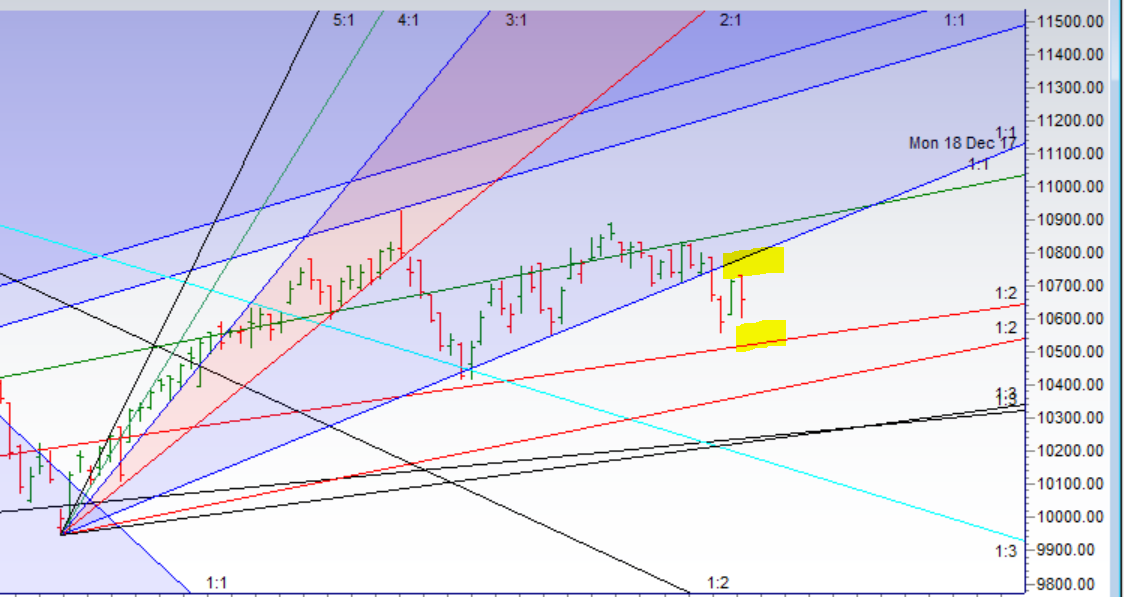
- As Discussed in Last Analysis Now bulls need a close above 10730 for a move towards 10777/10846/10930. Bearish below 10666 for a move back to 10610/10555/10512. High made was 10736 so bulls unable to hold 10730 as soon as 10666 broken we did our target of 10610 so again levels worked perfectly. Nifty below 10610 can again see correction till 10555/10510. Bullish above 10666 for a move back to 10730/10777. Important intraday time for reversal can be at 10:04/2:19. Bank Nifty did 26064 below 26280,EOD Analysis
- Nifty July Future Open Interest Volume is at 1.98 core with addition of 0.27 Lakh with decrease in cost of carry suggesting long position were added today, NF Rollover cost @10720 closed below it.
- 11000 CE is having Highest OI at 33.3 Lakh, resistance at 10800 followed by 11050 .10200-11000 CE added 4.4 lakh in OI so bears added position in range of 10800-11000 CE. FII sold 264 CE and 2.8 K CE were shorted by them. Retail bought 66.8 K CE and 41.4 K CE were shorted by them.
- 10600 PE OI@45.6 lakhs having the highest OI strong support at 10600 followed by 10650 . 10200-11000 PE added 24.9 Lakh in OI so bulls added position in range 10500-10600 PE. FII bought 7.1 K CE and 947 CE were shorted by them. Retail bought 21.9 K CE and 32.3 K CE were shorted by them.
- Total Future & Option trading volume at 5.63 Lakh core with total contract traded at 1.22 lakh , PCR @0.89
- FII’s sold 1205 cores and DII’s bought 366 cores in cash segment.INR closed at 68.80
- Nifty Futures Trend Deciding level is 10642 (For Intraday Traders). NF Trend Changer Level (Positional Traders) 10638. How to trade Nifty Futures and Bank Nifty Futures as per Trend Changer Level
Buy above 10666 Tgt 10690,10710 and 10730 (Nifty Spot Levels)
Sell below 10650 Tgt 10630,10610 and 10585 (Nifty Spot Levels)
Follow on Facebook https://www.facebook.com/Brameshs-Tech-14011718268586
Follow on Twitter:https://twitter.com/brahmesh