


Wishing Dear Readers a very very happy and prosperous and profitable new Year.
Traders New Year’s Resolutions for 2018
2017 year started with a rally after forming a bottom at 7893 on 26 Dec 2016 @7893 when both Gann Price and Time Squaring happened. Nifty staged a spectacular rally all the way till 10552. Its was the year where nifty never had correction of more than 2% on Closing basis, happened first time in Nifty trading history Nifty clocking a gain of 22 % in 2017 best year we had after 2009. We can consider 2017 as year of breakout, Expect some consolidation and lot of volatility in coming year. Monthly and Yearly chart of Nifty with time cycle are shown below.
Yearly Chart
Yearly chart have formed an Bullish Engulfing candlestick. Keep a Close eye on 01 Jan Opening level, and High formed on 31 Jan, they will decide the further trend of market.

Nifty bulls did a breakout after last 2 years of consolidation. Bulls should hold 10033 on Monthly closing basis for uptrend to continue and Bears should see Close below 10000 for some serious correction which they have been waiting for last 1 year 🙂
Monthly Gann Chart
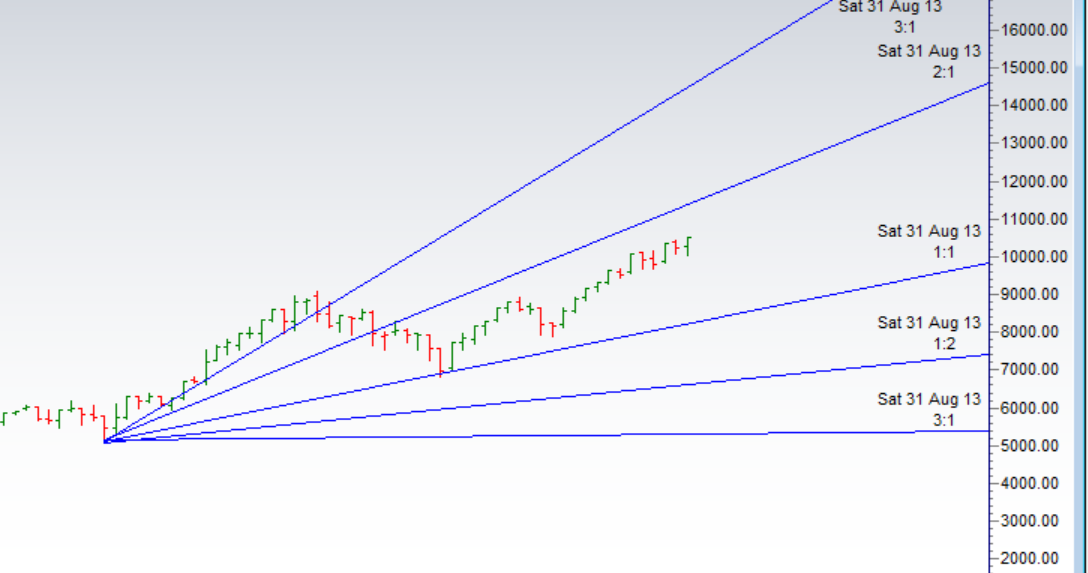
Monthly Chart with Gann Angles is shown Trend Continuation 11300-11500 where next major resistance lies,Closing above it can see fast rally towards 12000. Breakdown below 10090 for a move till 9448/9119/8600
Monthly Chart with Supply and Demand Zone

Yearly Trend Change Level: 10562
Yearly Resistance Level : 10813,11615,12157
Yearly Support Level : 10100,9559,9119
Important Dates as per Time Analysis :
Last Year Time Cycle dates can be seen here
Below dates can see Trend Change in Market.
01-01-2018
03-01-2018
25-01-2018
06-02-2018
16-02-2018
01-03-2018
16-03-2018
25-03-2018
04-04-2018
21-04-2018
07-05-2018
25-05-2018
17-06-2018
05-07-2018
10-08-2018
26-08-2018
17-09-2018
10-10-2018
28-10-2018
06-11-2018
18-11-2018
02-12-2018
18-12-2018
Click Here to Like Facebook Page get Real time updates
Follow on Twitter during Market Hours: https://twitter.com/brahmesh
All your Dates are off by 2/3 days. Other Gann trainers are able to give exact dates like 21Sept, 29th Jan etc.
Why is it So?
As we foretasted 1 year before so +-1 days is expected one. When you are seeing 2-3 days difference its basically due to market holiday like 02-Dec was holiday so effect seen on 03 Dec as we made top.. Having said that there is always room for improvement and we will work on that
Kindly advise if you teach Gann in Theory & Practicals. I would be delighted to participate in the learning. Kindly respond on my email id. thank you in advance.
sir,
are the Dates for 2018 GANN or Other ?
thanks
h.mehta
Mostly on other calculation..
Bramesh ji how much retracement usually achieved after trend change dates in nifty or stocks
min 125 max 40
thanks bramesh
Great analysis and update on time analysis Sir as always……….