


In Continuation with Previous Article Introduction to Bollinger Bands
Bollinger Band Trading Strategies
- Bollinger Bands to identify tops and bottoms
- Trend Following
- Bollinger Bands to identify tops and bottoms
Bollinger Band can be sued to identify potential tops and bottom in the stock/ETF. Following 3 points should be kept in mind to identify potential tops and bottom
- A trending price move beyond the upper band
- A pullback towards the middle of the Bollinger Bands
- Another move higher (past the previous price high) but not closing above the upper end of Bollinger Bands
A Bollinger Band top signals losing momentum in an uptrend. It is important to remember that closing prices are more important when using Bollinger Bands to understand the signal.
Let me explain the above strategy using Microsoft as an example.
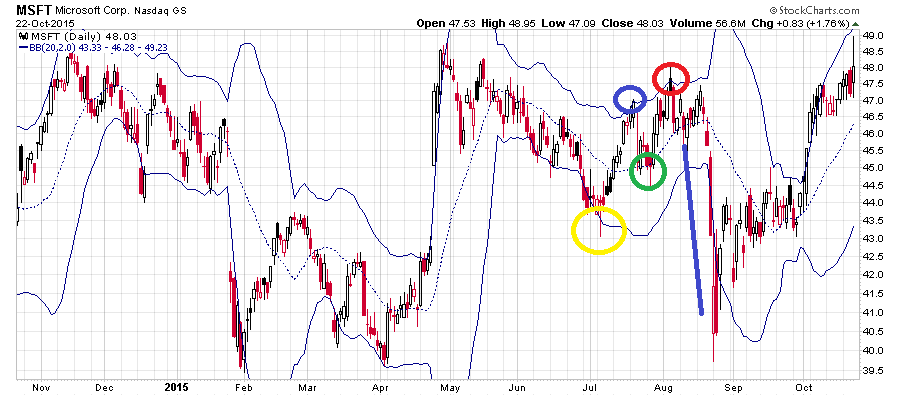
As seen in above chart Microsoft stock start rallying from the lower end of Bollinger band @ $44 07Jul 2015 marked by yellow circle and rallied till @$47 the blue circle till 21 Jul 2015, So our 1 condition of trending move is satisfied.
After that stock saw correction and corrected till middle band of Bollinger band till $45 on 28 Jul 2015 marked by green circle thus satisfying the second condition of pullback till middle end of Bollinger band.
After that stock again staged a rally till 05 Aug forming a new high $48 but was a unable to close above the Bollinger band upper band on 05 Aug marked by red circle on above chart also forming a bearish candlestick pattern and also satisfying the third condition “Another move higher (past the previous price high) but not closing above the upper end of Bollinger Bands”
Traders can take short with SL of $48 and target of lower end of Bollinger band which was achieved on 24 Aug.
The reverse rules can be applied for finding the bottom of any trading instrument.
- Trend Following using Bollinger Bands
We use Trend Following in Bollinger Band when price Moves above or below the bands.
A move above the upper band shows strength, while a sharp move to the lower band shows weakness. As per classical Technical Analysis overbought conditions can extend in a strong uptrend and oversold conditions can extend in downtrend.
Similarly, prices can touch the upper and lower end of Bollinger Band with numerous touches during a strong uptrend or downtrend. It is also common for prices to never reach the lower band during an uptrend and upper end during a downtrend. The 20-day SMA or middle line of Bollinger Band sometimes acts as support and resistance in uptrend and downtrend. Dips around the 20-day SMA or middle line of Bollinger Band sometimes provide buying opportunities during strong uptrend and Rallies near 20-day SMA or middle line of Bollinger Band sometimes provide selling opportunities during down uptrend
Let me explain the above strategy using Caterpillar stock as an example.

As seen in above CAT chart price touched the upper end of Bollinger Band on 23 June 2015@$88 marked by Blue circle, price started correcting closing below the middle line @ $86 on 26 June 2015. Price continued with its correction and touched the lower end of Bollinger Band marked by yellow circle on 29 June 2015 @ $84.3
Shorts can be taken with Stoploss of price closing above middle line of Bollinger band and riding the trend. Price continued correction made low of $80.71 on 09 Jul 2015.
After touching the low price started showing pullback rallied till middle line of Bollinger band shown by green circle were unable to close above it formed a bearish candlestick and again gave a trending move on downside.
Conclusions
Bollinger Bands are a great tool because they can do a variety of different things at the same time. The reason for that is because they are very close to the actual price, they consist of different things (a moving average and a standard deviation measurement) and they can be combined with different indicators easily. Bollinger Bands reflect direction with the 20-period SMA and volatility with the upper/lower bands. As such, they can be used to determine if prices are relatively high or low. According to Bollinger, the bands should contain 88-89% of price action, which makes a move outside the bands significant. Technically, prices are relatively high when above the upper band and relatively low when below the lower band. However, relatively high should not be regarded as bearish or as a sell signal. Likewise, relatively low should not be considered bullish or as a buy signal. Prices are high or low for a reason. As with other indicators, Bollinger Bands are not meant to be used as a standalone tool. Traders should combine Bollinger Bands with basic trend analysis and other indicators for confirmation.
Thank you for sharing the article with us.
one request to you. if will be nice if you could create a youtube channel and share the same technical analysis with us. it will be a great help to us.
Cheers
Sir
Something about renko…pl
TIA.
Thank you Sir for a great article on Bollinger Bands. Is Bollinger bands effective in Trading Gold with proper money management and trading mindset.
Regards Sam.
Yes..
Thank you Sirji..