


HDFC BANK
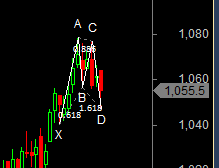
Positional/Swing Traders can use the below mentioned levels
Close above 1060 Tgt 1076/1100
Intraday Traders can use the below mentioned levels
Buy above 1057 Tgt 1064,1073 and 1082 SL 1050
Sell below 1045 Tgt 1039,1030 and 1020 SL 1051
Adani Ports
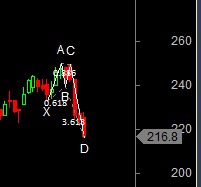
Positional/Swing Traders can use the below mentioned levels
Holding 212 Tgt 225/233
Intraday Traders can use the below mentioned levels
Buy above 218 Tgt 220.2,224 and 226 SL 216
Sell below 215 Tgt 212.5,209 and 207 SL 216.5
ICICI Bank
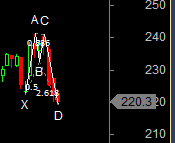
Positional/Swing Traders can use the below mentioned levels
Holding 217 Tgt 230
Intraday Traders can use the below mentioned levels
Buy above 221.5 Tgt 223,225 and 227.5 SL 220
Sell below 219 Tgt 218,216 and 213 SL 220.5
How to trade Intraday and Positional Stocks Analysis — Click on this link
Performance sheet for Intraday and Positional is updated for March Month, Intraday Profit of 3.22 Lakh and Positional Profit of 6.46 Lakh
http://tradingsystemperformance.blogspot.in/
http://stockpositionaltrading.blogspot.in/
- All prices relate to the NSE Spot/Cash Market
- Calls are based on the previous trading day’s price activity.
- Intraday call is valid for the next trading session only unless otherwise mentioned.
- Stop-loss levels are given so that there is a level below/above, which the market will tell us that the call has gone wrong. Stop-loss is an essential risk control mechanism; it should always be there.
- Book, at least, part profits when the prices reach their targets; if you continue to hold on to positions then use trailing stops to lock in your profits.
Follow on Facebook during Market Hours: https://www.facebook.com/pages/Brameshs-Tech/140117182685863
ICICI is stuck, its not moving much today; whereas HDFC is highly erratic